In this briefing:
- Japan: Moving Average Outliers – Tech[nical] Rebound
- Nidec (6594 JP): Recovery to Take Time, Valuations Still High
- Pioneer Shareholders Approve Deal
- 31 January TOPIX & JPX Nikkei 400 Major Index Changes
- Japan: Consistency Scores – Steady Eddies V. Rollercoaster Rides
1. Japan: Moving Average Outliers – Tech[nical] Rebound

– MARKET COMPOSITE –

SLOW & STEADY RECOVERY – From December 25th’s lows of 8% by number and 11% by value, the percentages of Japanese stocks above the weighted sum of moving averages have continued to recover to now 19% by number and 26% by value. Total Market Value has now risen by 11.2% from the Christmas Day low and is overdue a ‘breather’.
– SECTORS –
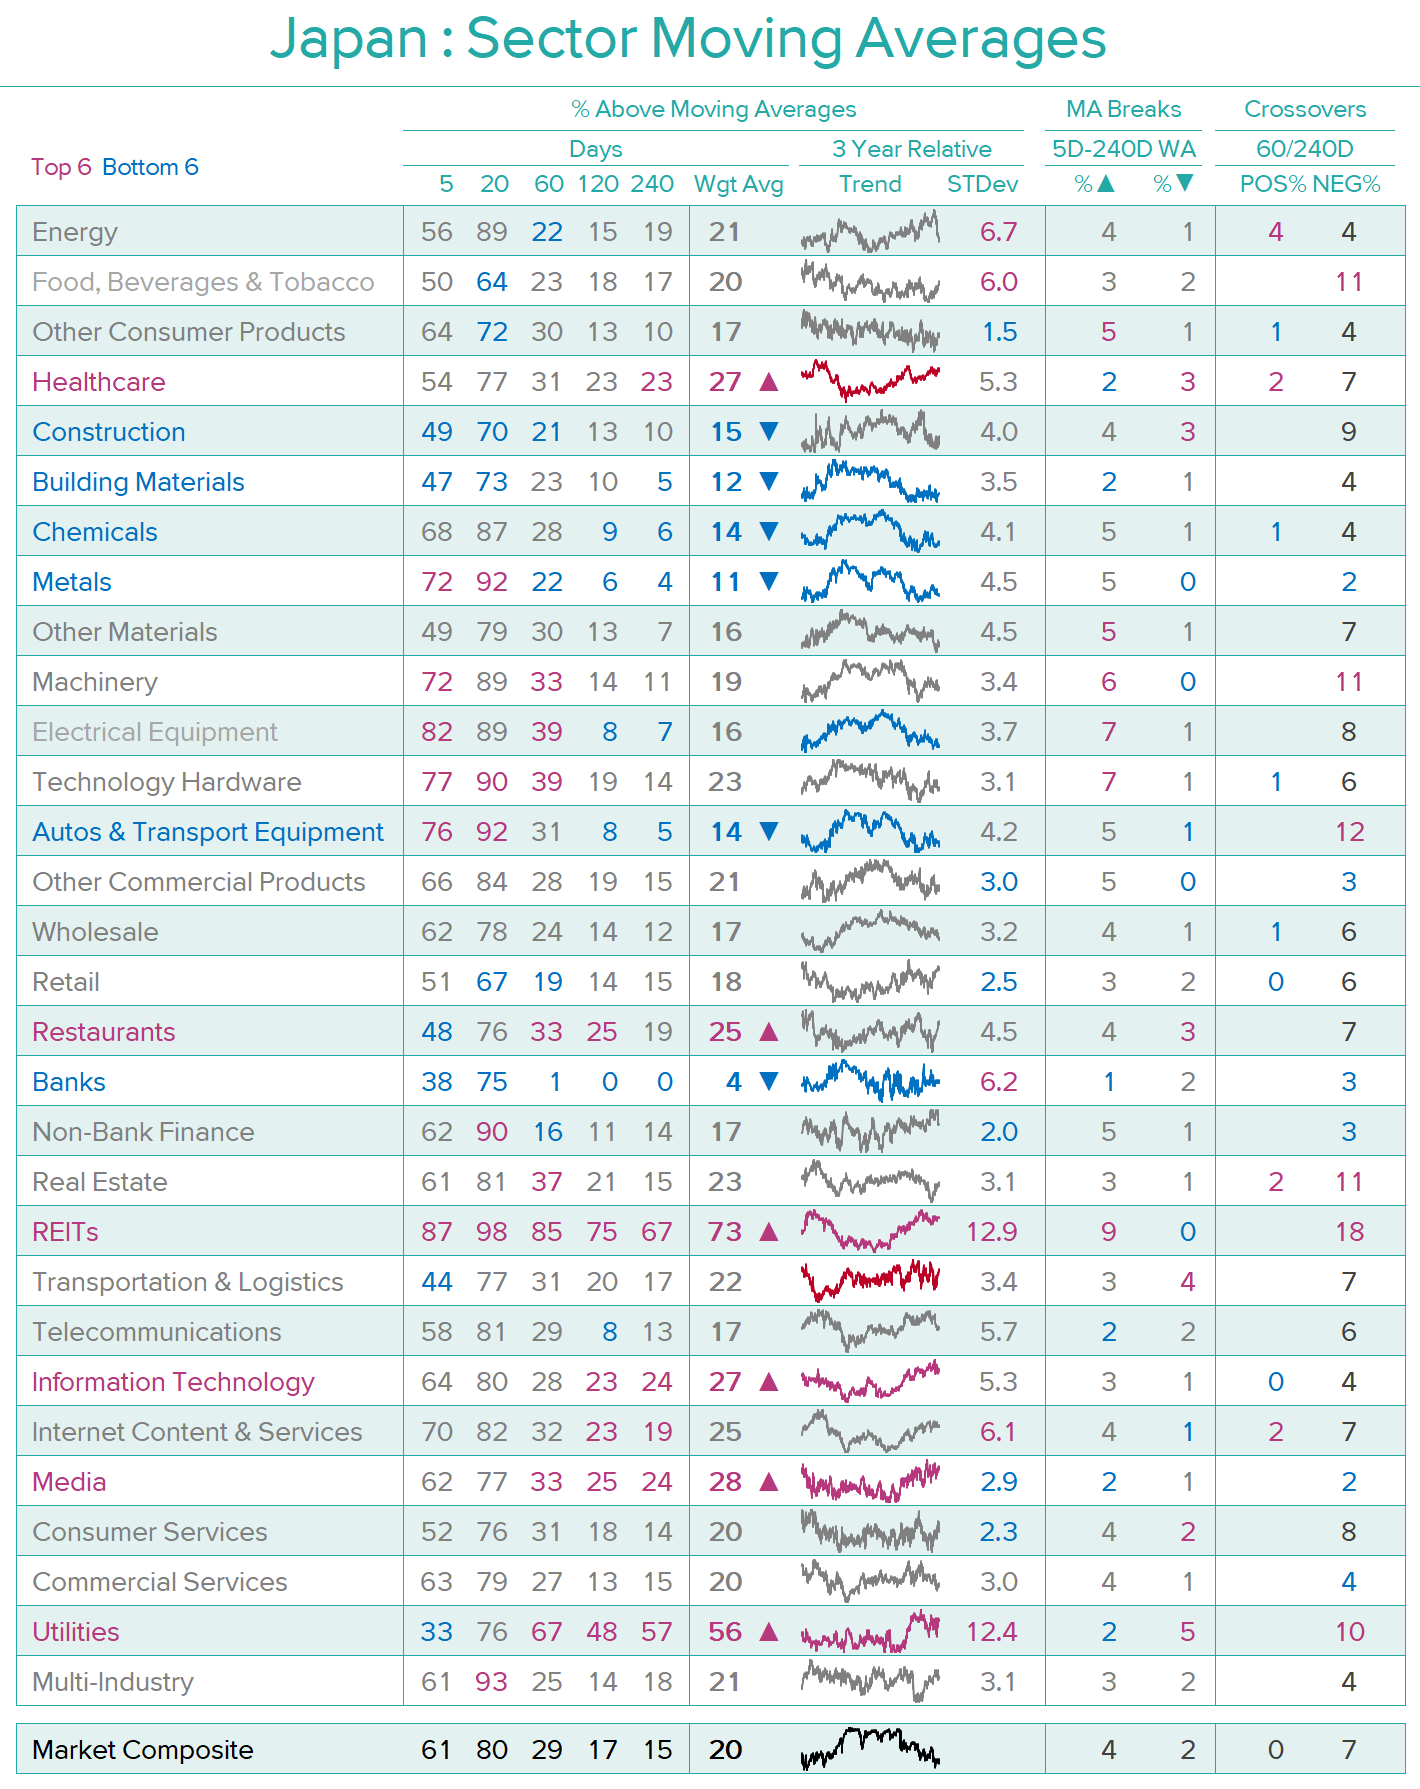
SECTOR BREAKDOWN – The top six sectors measured by their percentage above the weighted average of 5-240 Days remain domestic and defensive. REITs, Information Technology, Media, Healthcare and Utilities continue from our previous review with Restaurants replacing Transportation. Equally predictable is the bottom half-dozen – Banks, Autos, Metals, Building Materials, and Chemicals remain from two weeks ago, with Construction replacing Autos.
– COMPANIES –


Source: Japan Analytics
COMPANY MOVING AVERAGE OUTLIERS – As with the Market Composite and Sectors, the Moving Average Outlier indicator uses a weighted sum of each company’s share price relative to its 5-day, 20-day, 60-day, 120-day and 240-day moving averages. ‘Extreme’ values are weighted sums greater than 100% and less than -100%. We would caution that this indicator is best used for timing shorter-term reversals and, in many cases, higher highs and lower lows will be seen.
In the DETAIL section below, we highlight the current top and bottom twenty-five larger capitalisation outliers, as well as those companies that have seen the most significant positive and negative changes in their outlier percentage in the last two weeks and provide short comments on companies of particular note. UUUM (3990 JP) is currently the most ‘extreme’ positive outlier, and Welcia (3141 JP) the most ‘extreme’ negative outlier
2. Nidec (6594 JP): Recovery to Take Time, Valuations Still High

After dropping to a 52-week low of ¥11,405 on January 17 – the day after management announced a large downward revision to sales and profit guidance – Nidec rebounded to close at ¥13,055 on Friday, January 25. The latter price is 30% below the ¥18,525 peak reached a year earlier. Both the shock of the downward revision and the reflexive optimism of believers in the company now seem to have been discounted.
Consolidated sales and profits dropped abruptly in the three months to December and are expected to drop further in 4Q of FY Mar-19 due to weak demand in most regional markets, inventory write-downs and restructuring costs. Nidec is already reconfiguring its global supply chains, shipping products to the U.S. from Mexico and Europe instead of from China and planning to build factories to make motors for electric vehicles in Mexico and Poland in addition to China.
With most of the one-off expenses out of the way, profits should start to recover in FY Mar-20. Sales, on the other hand, seem likely to decline further due to weak unit demand and pricing for HDD spindle motors, falling auto production in China and elsewhere, and weakness in other industrial and commercial markets. Recovery will depend on U.S.-China trade relations and the state of the world economy, and new acquisitions that cannot be predicted. As things stand now, we expect sales to pick up going into FY Mar-21. In the long run, the company should continue to benefit from the electrification of the auto market and factory automation.
At ¥13,055, the shares are selling at 34x management’s EPS guidance for FY Mar-19, 32x our estimate for FY Mar-20 and 30x our EPS estimate for FY Mar-21. Projected EV/EBITDA multiples for the same three years are 18x, 17x and 15x. Price/book value as of the end of December is 3.9x. The dividend yield is less than 1%. Over the past few years, the P/E has found support at 20x, EV/EBITDA at 10x and the PBR at 2.5x. The January 17 low put the shares on 30x management’s new EPS guidance for this fiscal year.
3. Pioneer Shareholders Approve Deal
On Friday 25 January 2019, shareholders of Pioneer Corp (6773 JP) voted to implement a self-imposed (self-inflicted?) equity “cramdown” of sorts.
In September, Pioneer and BPAE signed a memorandum of understanding whereby Baring Private Equity Asia would lend money to Pioneer and subsequently inject equity capital and keep the company listed. In December, BPAE and Pioneer management decided that the equity injection would push out then-existing shareholders at a steep discount to the lowest share price the stock had theretofore seen in the company’s 50-year-plus history of being listed.
Now that’s done.
The situation now looks quite a bit like a regular “risk arb” or “wind up” situation, though investors do not have exact understanding of the payment date.
What comes next is outlined below.
4. 31 January TOPIX & JPX Nikkei 400 Major Index Changes

On December 17th 2018, the TSE announced a somewhat strange and unexpected treatment of the TSE-calculated indices for two companies where shares were issued to shareholders of a foreign company where the Japanese company had acquired the foreign company through a Scheme of Arrangement under foreign jurisdiction.
The two companies were LIFULL (2120 JP) and Takeda Pharmaceutical (4502 JP).
The announcements for TOPIX and JPX Nikkei 400 were made then, and despite the events being entirely similar in construct, but different in month of Scheme Effective Date, they were put in the same month for Mitula and the first tranche of the Takeda inclusion, which was split between two months because of its large impact.
The large IPO last month of Softbank Corp (9434 JP) means there is another large inclusion going effective as of the open of trading on 31 January.
Wednesday is going to be a big day.
If everyone trades their required index amount on the day, it should be a trillion yen plus of flows.
5. Japan: Consistency Scores – Steady Eddies V. Rollercoaster Rides


Source: Japan Analytics
CONSISTENCY PAYS – In troubled markets, investors often seek out companies with greater earnings stability and a history of consistent stock outperformance. Conversely, companies that offer investors more of a rollercoaster ride (Chiyoda Corp (6366 JP) being an excellent recent example) are less rewarding, especially when adjusted for volatility. In an attempt to sort the ‘Steady Eddies’ from the Rollercoaster Rides’, we have created a Consistency Score – a composite based on our Results Score, Forecast/Revision Score, Relative Price Score and Volume Score – which measures the variability, consistency, correlation, and range of each of these scores for every company. Cap-weighted aggregate Consistency Scores are then derived for 321 Peer Groups and 29 Sectors – REITs are excluded from this analysis. Over 3 million data points have been reviewed in creating this analysis. As the old slogan goes – “we do the work, so you don’t have to’.
‘CARP = CONSISTENCY-AT-A-REASONABLE-PRICE‘ – Our findings will not surprise long-term investors in Japanese equities; the simple asset allocation decision to prefer domestic growth over global value has determined the quartile-ranking of many strategies in recent years. Although many of these Sectors, Peer Groups and stocks are now overvalued, we do not expect the underlying business dynamics to change in the years ahead and many excellent investment opportunities remain, especially down the cap-scale. Periodic and often substantial mean reversions in the more cyclical sectors, such as the one that has occurred in the last two days, will offer attractive trading opportunities for more-nimble portfolio managers. Longer-term orientated investors are better-advised to continue to favour ‘consistency-at-a-reasonable-price’. Some of our ‘findings’, as explained in more DETAIL below, are as follows: –
- SECTORS – The better investors in Japan over the last two decades have eschewed traditional manufacturing in favour of Services, IT/Internet, Retail, Restaurants and ‘FB&T‘. Only Machinery and Electrical Equipment outperformed the market’s 4% compound annual growth rate (CAGR) over the period.
- PEER GROUPS– The most-consistent Peer Groups are found in industries associated with food, drugs, welfare, shelter and amusement. Only five of the top-forty Peer Groups – Online Payment Services, E-Commerce, IT System Services, Telecom Distribution Services and Internet Software & Services belong to the ‘new age’. There are no manufacturing Peer Groups in the top-forty. The best performing Peer Group is Securities Services, and the worst-performing is Investment Management & Advice. Although both have similar levels of consistency, the stock exchange has beaten its fund managers by 28% annually since 2005.
- COMPANIES – The simple average fourteen-year compound annual share price appreciation for all listed large-cap companies is +5.1%. For all listed companies the average falls to just +0.5%, highlighting the perils of investing in Japan’s small caps. The average share price CAGR for our hindsight-selected top-forty is +18.7%. In contrast, only one of our forty least-consistent companies outperformed the market and the average for the least-consistent forty companies was a negative -3.2%. Unsurprisingly, there are eight banks and six steel companies on the list, along with two glass companies and two shipping lines.
- CONSISTENCY HALL OF FAME/SHAME AWARDS – We have selected one company from each of the most and least consistent lists as the winner of a ‘Consistency Award’. Both are highlighted in the chart above. One of them will be as surprising to many readers as it was to us.
Get Straight to the Source on Smartkarma
Smartkarma supports the world’s leading investors with high-quality, timely, and actionable Insights. Subscribe now for unlimited access, or request a demo below.
