In this briefing:
- Musashino Bank (8336 JP): Braking Bad
- Japan: Catching Valuation Differences – Worst Quarter Since 2017-Q2 – Time for Shareholders to Act
- Japan: Fortnightly Update: Past the Peak
- THK (6481 JP): New Orders Down by Two-Thirds in 4Q, Near the Bottom of the Cycle
1. Musashino Bank (8336 JP): Braking Bad

Musashino Bank (8336 JP) was one of the last regional banks to announce 3Q FY3/2019 results, and they were a nasty surprise: a consolidated net loss for the nine months to 31 December 2018, caused by heavy reserving in Q3 (October-December 2018) against the bank’s exposure to the troubled Akebono Brake Industry Co (7238 JP) . While the bank has slashed its full-year net profit guidance from ¥11.1 billion to ¥4.5 billion, this would still require an heroic level of profits in Q4 which the bank has never before achieved. The share price has fallen over 31% in the last twelve months. Valuations at current levels are still high (FY3/2019 PER is 17.6x) and we consider the share price to be vulnerable to further weakness. Caveat emptor (May the buyer beware) !
2. Japan: Catching Valuation Differences – Worst Quarter Since 2017-Q2 – Time for Shareholders to Act

COMPREHENSIVE INCOME – Since 2011, a Statement of Comprehensive Income (CSI) has been a mandatory addition to the Income Statement for Japanese companies reporting under Japanese GAAP (J-GAAP). CSI has long been a part of US-GAAP and is also an integral part of the IFRS reporting standards. A critical difference is that under J-GAAP, items of Other Comprehensive Income (OCI) are added or subtracted from Net Assets and do not impact Shareholder’s Equity which is the denominator for Return on Equity (RoE). Under US-GAAP and IFRS the amounts are deducted from Shareholder’s Equity and, therefore, as an increasing number of Japanese companies are switching to IFRS, these items cannot be ignored and can often lead to significant changes in RoE calculations.
VALUATION DIFFERENCES – In an earlier Insight Japan: What to Buy & Sell if the ¥ Rises to 90, we used the Foreign Currency Translation Adjustment item in Other Comprehensive Income to determine companies’ sensitivity to changes in exchange rates. In this Insight, we look at the Valuation Differences item which is more fully described as “Unrealised Gains/Losses on Available-for-Sale Securities”. With many Japanese companies running in effect long/short equity funds (see our recent Insight on Toppan Printing: Money for Nothing), the quarterly portfolio ‘marks’ are a useful performance update. The extent to which shareholders should condone these efforts at ‘cash management’ is a wider topic which has been covered by Travis Lundy. Some companies, such as Tokyo Broadcasting System (9401 JP), have already seen ‘attention’ from activist investors, while others, such as Toyota Industries (6201 JP) and Japan Petroleum Exploration (1662 JP), feature in the Smartkarma HoldCo Monitor and are familiar to this audience. For the others, at the very least, we can start the exercise of ‘naming and shaming’ to encourage more scrutiny in the future.

Source: Japan Analytics
WORST QUARTER FOR VALUATION DIFFERENCES SINCE FY2017 Q2 – The aggregate of the Valuation Differences for all 3,574 listed non-financial companies for the most recent quarter was -¥85b, the worst result since 2017 Q2. As not all of the securities valued are domestic equity, the correlation with the Japanese equity market is not exact and movements in the US$/¥ exchange rate also play a role. Only a small percentage of companies have significant valuation differences. In the most recent quarter, only 29 companies saw a positive change of more than ¥1b. However, 637 saw a negative change or at least -¥1b. In the DETAIL section below we shall look at the top twenty-five companies by negative and positive change relative to both shareholder’s equity and market capitalisation and make some brief comments on a number of companies, including Japan Petroleum Exploration (1662 JP), Tokyo Broadcasting System (9401 JP), Toyota Industries (6201 JP), Mitsubishi Materials (5711 JP) , Vital KSK (3151 JP), Bank Of Kyoto (8369 JP), Toppan Printing (7911 JP), and Inabata (8098 JP).
SHAREHOLDER ACTION REQUIRED – A large number of Japanese companies continue to hold large investment portfolios and the various iterations of Japan’s Corporate Governance Code have tried to nudge companies towards reducing such holdings. The latest version which was released in June 2018 and was well-covered by Travis Lundy in his excellent Insight – Japan’s Corporate Governance Code Amendments – A Much Bigger Stick for Activists and Stewards. The relevant provision is as follows: –

As Travis then noted: –
This is Big News. It means there is considerable friction, and explanatory embarrassment, in continuing to hold cross-holdings.
- Every year requires a reassessment of the financial benefits and the return on capital measured against the cost of capital. This will not be pretty.
- Requiring a set of policies on voting shares probably means setting standards which would not be lesser than the standards they adhere to in their own business. And it would require the possibility they might vote against management.
- It would be much easier to just get rid of the Cross-Shareholdings. The boards of the major banks, which each hold hundreds of cross-shareholding positions, will need to reassess each of the positions on an economic basis and business basis every single year. Expect this to change quickly. This is the perfect excuse for banks and corporates to say “Shōganai”, and sell.
SO FAR, NOT MUCH – In the seven months the revised code has been in effect, this ‘bigger stick’ has yielded few results as companies continue to hold onto their portfolios and file ‘boilerplate’ statements in the Corporate Governance filings. The author and leading promoter of the Governance Code, Nicholas Benes, has just made an interesting proposal on his blog entitled How to Demolish Japan’s Wall of Yes-Man Allegiant Shareholders which we have reproduced in full at the end of the DETAIL section below.
We recommend that all institutional shareholders of Japanese equities take note and follow Mr Benes’ suggestion to vote against the two most senior executive directors (usually, the CEO and Chairman) up for re-election if the total “policy shareholdings” held by a company exceed 25% of the amount of net assets less cash.
3. Japan: Fortnightly Update: Past the Peak


PEAK CYCLE EARNINGS – In our Winter Results & Revisions Flash Insight of yesterday, we noted that Japanese listed corporate earnings, after nine consecutive ‘up’ quarters, peaked on December 26th, two days before the market reached a twenty-month low having declined 22.5% in the preceding three months. Forecast earnings peaked on November 7th and have led reported earnings to the downside since August last year.

ONE-YEAR LAG – Reported and forecast earnings are a lagging indicator and, in this instance, lagged by just under one year. Our preferred leading indicator, the Results & Revision Score which includes earnings momentum factors, peaked on 11th November 2017, 44 trading days ahead of the peak in the Market Composite. As of Friday’s close and with 99% of this quarters’ announcements made, the Results & Revisions Score is at a new 21-month. The score has now fallen by 70% and has halved since October 26th last year. We will cover the outlook in more detail in our upcoming quarterly Results and Revision review. However, the last two cycles (2009 and 2016) saw ‘trough’ scores of -9.6 and -2.1, respectively. There is ample room on the downside as export volumes continue to decline and the increase in the consumption tax in October tips Japan into a recession by year-end.

SIDEWAYS – The market has moved sideways through the reporting window rising 0.7% in Yen terms and falling 0.7% in US$ terms. The weakness in the currency has helped offset the slide in profits.
MARKET/SECTOR STRATEGY- We continue to recommend an underweight position in Japan in global portfolios and favour undervalued domestically-orientated companies in the Information Technology, Internet, Media, and Telecommunications sectors. We would avoid or short the financial sectors Banks, Non-Bank Finance and Multi-Industry (Japan Post). We would underweight the Auto and Other Consumer Products sectors as consumer spending contracts further in the US, Europe, China and in Japan later in the year.
In the DETAIL section below, we will review Sector performance over the last two weeks, and, in addition to our regular roundup of company results, revisions and stock performance over the previous two weeks, including brief comments on Subaru (7270 JP), Infomart (2492 JP), Lion (4912 JP), Nissan Chemical (4021 JP), Keyence (6861 JP), Suruga Bank (8358 JP), and Mercari (4385 JP).
4. THK (6481 JP): New Orders Down by Two-Thirds in 4Q, Near the Bottom of the Cycle
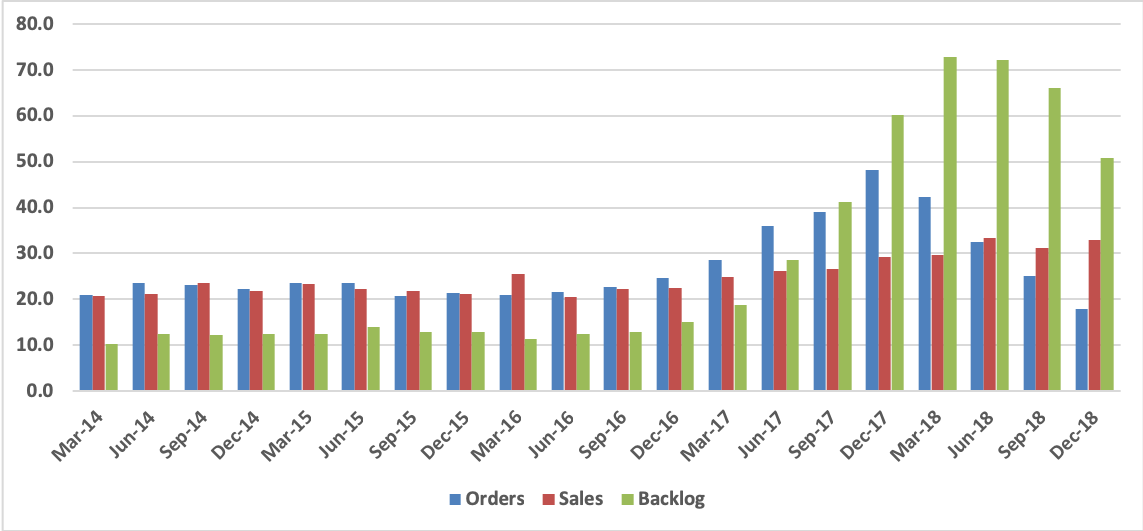
Sales and profits were above management’s guidance in FY Dec-18, with operating profit rising 36.9% on a 10.9% increase in sales. But new orders continuously declined and were down about two-thirds year-on-year in 4Q.
In view of the order flow, management is guiding for a 12% decline in sales and a 44% decline in operating profit in FY Dec-19, a forecast that is roughly in line with our own.
On the positive side, historical data indicates that new orders are at or near the bottom of the cycle. Anticipating a better investment climate after some resolution of the U.S.-China trade problem, we are forecasting an increase in sales and profits going into FY Dec-20.
The shares have rebounded by 41% since the beginning of January. At ¥2,720 (Friday, February 15, close), they are selling at 15.6x our estimate for FY Dec-19 and 13.8x our estimate for FY Dec-20E. These multiples look reasonably attractive in comparison with the company’s recent P/E range.
Get Straight to the Source on Smartkarma
Smartkarma supports the world’s leading investors with high-quality, timely, and actionable Insights. Subscribe now for unlimited access, or request a demo below.
