In this briefing:
- SoftBank Corp (9434 JP) & Arteria Networks (4423 JP): A Tale of Two IPOs
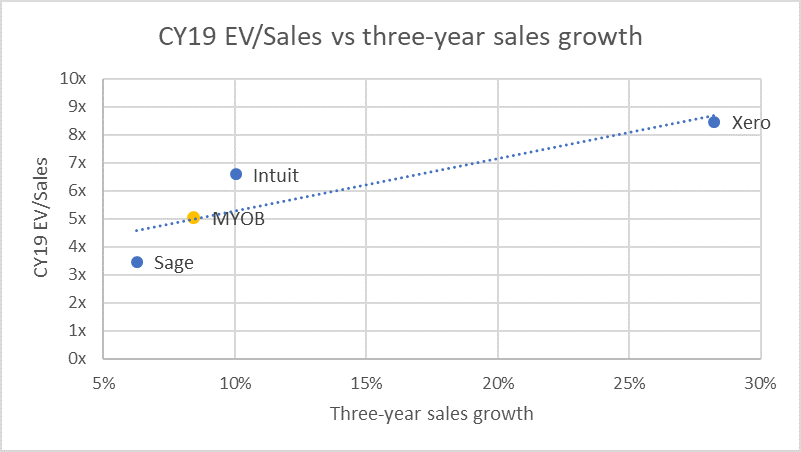
- MYOB Caves And Agrees To KKR’s Reduced Offer
- COM7 (COM7 TB): Acquisition to Support Aggressive Expansion
- TRACKING TRAFFIC/Chinese Express & Logistics: Parcel Pricing Weak, Again
- Elastic: Why Is It Outperforming In Recent Tech Carnage?
1. SoftBank Corp (9434 JP) & Arteria Networks (4423 JP): A Tale of Two IPOs

During the second half of December 2018, Japan saw two telecom companies list on the Tokyo Stock Exchange: Softbank Corp (9434 JP) and ARTERIA Networks (4423 JP). After years of industry consolidation, which saw several stocks delist, this felt like a Christmas miracle (at least for those watching the sector’s stocks).
It would be hard to find two companies in the same industry that are so different – both in their business models as well as in how their IPOs were positioned to investors. One stock is 100 times larger than the other, but this is not a story of David and Goliath. It is two unique stories in parallel.
While each company took a very different approach to selling its stock, both have suffered from the subsequent broader market weakness, irrespective of company specifics. We can’t say it has been the worst of times, but it certainly has been a tough time with SoftBank Corp down 13% and Arteria down 20% from their IPO prices.
In this Insight we explore how each company approached its IPO and how each has fared since.
2. MYOB Caves And Agrees To KKR’s Reduced Offer

It could have gone either way.
After securing a 19.9% stake from Bain in early October and initially pitching A$3.70/share, in a textbook bear hug, KKR (marginally) bumped its indicative offer to A$3.77/share to a get a look under the hood, then following seven weeks of due diligence, backtracked with a lower price of A$3.40/share, citing adverse market conditions.
MYOB Board’s response last week to the reduced offer was to inform KKR that it is not in a position to recommend the revised proposal, however, “it remains in discussions with KKR regarding its proposal”, leaving the door open for ongoing negotiations. KKR for its part, said there were no landmines following the DD process. The price action last Friday suggested the outcome was a coin toss.
Today, KKR and MYOB entered into Scheme Implementation Agreement (SIA) at $3.40/share, valuing MYOB, on a market cap basis, at A$2bn. MYOB’s board unanimously recommends shareholders to vote in favour of the Offer, in the absence of a superior proposal and subject to an independent expert concluding the Offer is in the best interest of shareholders. The Offer price assumes no full-year dividend is paid.
The agreement provides a “go shop” provision until the 22 February 2019 – when MYOB is expected to release its FY18 results – to solicit competing proposals.
The Offer appears reasonable when compared to peers and with regards to the 14% decline in the ASX technology index; but conversely, could be construed as being opportunistic.
A Scheme Booklet is expected to be dispatched mid-March with an estimated implementation date of 3 May. Currently trading at a 3.8%/11% gross/annualised spread. 1 January makes a new year and there will be investors who would want to take an agreed deal at 11%.
3. COM7 (COM7 TB): Acquisition to Support Aggressive Expansion
- Improving asset turnover, good risk adjusted price momentum, and relatively strong analyst recommendations relative to its sector
- Larger distribution channel through acquisition of DNA Retail Link to add 95 more stores to current 518 stores
- New mobile product launches in 4Q18 and COM7’s focus on high margin products, such as Android smartphones, should support high earnings growth which was up 56% YoY in 3Q18
- Attractive at a 19CE* PEG of 0.9 versus ASEAN sector at a PEG of 2.7
- Risks: Lower-than-expected demand for new IT products, slower-than-expected store expansions
* Consensus Estimates
4. TRACKING TRAFFIC/Chinese Express & Logistics: Parcel Pricing Weak, Again


Tracking Traffic/Chinese Express & Logistics is the hub for our research on China’s express parcels and logistics sectors. Tracking Traffic/Chinese Express & Logistics features analysis of monthly Chinese express and logistics data, notes from our conversations with industry players, and links to company and thematic notes.
This month’s issue covers the following topics:
- November express parcel pricing remained weak. Average pricing per express parcel fell by 7.8% Y/Y to just 11.06 RMB per piece. November’s average price represents a new all-time low for the industry, and November’s Y/Y decline was the steepest monthly decline in over two years (excluding Lunar New Year months, which tend to be distorted by the timing of the holiday).
- Express parcel revenue growth dipped below 15% last month. Weak per-parcel pricing pulled express sector Y/Y revenue growth down to just 14.6% in November, the worst on record (again excluding distorted Lunar New Year comparisons). Chinese e-commerce demand has slowed and we suspect ‘O2O’ initiatives, under which online purchases are fulfilled via local stores, are also undermining express demand growth.
- Intra-city pricing (ie, local delivery) remains firm relative to inter-city. Relative to weak inter-city express pricing (where ZTO Express (ZTO US) and the other listed express companies compete), pricing for local, intra-city express deliveries remained firm. In the first 11 months of 2018, express pricing rose 1.7% Y/Y versus a -2.9% decline in inter-city shipments (international pricing fell sharply, -14.5% Y/Y). Relatively firm pricing on local shipments may make it hard for local food delivery companies like Meituan Dianping (3690 HK) and Alibaba Group Holding (BABA US) ‘s ele.me to beat down unit operating costs.
- Underlying domestic transport demand held up well again in November. Although demand for speedy, relatively expensive express service (and air freight) appears to be moderating, demand for rail and highway freight transport has held up well. The relative strength of rail and water transport (slow, cheap, industry-facing) versus express and air freight (fast, expensive, consumer-oriented) suggests a couple of things: a) upstream industrial activity is stronger than downstream retail activity and b) the people in charge of paying freight are shifting to cheaper modes of transport when possible.
We retain a negative view of China’s express industry’s fundamentals: demand growth is slowing and pricing appears to be falling faster than costs can be cut. Overall domestic transportation demand, however, remains solid and shows no signs of slowing.
5. Elastic: Why Is It Outperforming In Recent Tech Carnage?

- Elastic NV (ESTC US) has been one of the best tech IPOs globally in 2018. Its current price is $62.53, up 74% from its IPO price of $36. Elastic’s share price has been holding up very nicely since its IPO on October 5th, 2018. Meanwhile, from October 5th to December 21st 2018, many tech stocks have experienced brutal declines. Elastic’s ability to outperform the top US tech stocks in a very difficult environment for the stock market sets the stage for a continued out-performance once the stock market starts to stabilize.
- Since the IPO, the company reported better than expected second quarter results (quarter ending October 31, 2018) on December 4th. The company’s adjusted net loss in FY2Q19 was $0.38 per share, beating analysts’ consensus estimate by 9 cents. It generated revenue of $63.6 million, up 72% YoY. Calculated billings were also strong at $88.5 million, up 73% YoY.
- The company’s guidance for FY3Q19 (quarter ending January 31, 2019) is to generate revenue in the range of $64 million to $66 million, representing a 56% YoY growth rate at the midpoint of the guidance. It expects to generate operating margin of negative 28% to negative 30% in FY3Q19.
- A combination of major investors shifting their assets away from FAANG and semiconductor stocks has resulted in some improved performance of many software related stocks in recent months relative to other major tech stocks. In general, these stocks face less negative impact from a prolonged trade war between China and the US. Plus, they are not as exposed to the higher cycle volatility as the semiconductor related stocks. In many respects, Elastic shares many business similarities with these software driven companies, and thus has been more immune from the decline in the stock prices since early October. We remain positive on Elastic NV (ESTC US).