68.30 long entry was recommended to close at the 77-80 area with 80 acting as the macro bull/bear line in our insight Ping An Long Pair Working – Risk of New Lows . The rejection call at 80 was expected to usher in selling pressure to press on new lows.
Ping An’s safe haven status has evaporated and does exhibit future vulnerabilities in HK’s underlying cycle (late Q1 into Q2). In our last insight we outlined that Ping An shows increasing risk that its safer have position will come under pressure and so it has.
New lows are still targeted. The current bounce is knocking on formidable resistance that should be used to sell stale long positions or even take a short bet.
Get Straight to the Source on Smartkarma
Smartkarma supports the world’s leading investors with high-quality, timely, and actionable Insights. Subscribe now for unlimited access, or request a demo below.
68.30 long entry was recommended to close at the 77-80 area with 80 acting as the macro bull/bear line in our insight Ping An Long Pair Working – Risk of New Lows . The rejection call at 80 was expected to usher in selling pressure to press on new lows.
Ping An’s safe haven status has evaporated and does exhibit future vulnerabilities in HK’s underlying cycle (late Q1 into Q2). In our last insight we outlined that Ping An shows increasing risk that its safer have position will come under pressure and so it has.
New lows are still targeted. The current bounce is knocking on formidable resistance that should be used to sell stale long positions or even take a short bet.
Broad global indexes are bumping up against logical downtrend resistance. As a result, our outlook remains cautious and our baseline expectation for continued downward pressure on global equities remains intact. At the same time, we are seeing signs that the worst of the declines may be behind us as global cyclical Sectors show RS improvements while defensive Sectors display early signs of RS deterioration. In this report we review important technical levels for developed and EM indexes, and highlight a number of attractive opportunities across markets and sectors.
In this report we detail our U.S. investment thesis and provide a detailed technical appraisal of the broad market, as well as highlighting attractive investment opportunities within each of our 12 Sectors.
Holding floor support is vital for this trade to work. In absolute terms both APG and APC display similarly weak chart structures with risk of a final bout of weakness. APG displays a more depressed chart reading however.
Get Straight to the Source on Smartkarma
Smartkarma supports the world’s leading investors with high-quality, timely, and actionable Insights. Subscribe now for unlimited access, or request a demo below.
Broad global indexes are bumping up against logical downtrend resistance. As a result, our outlook remains cautious and our baseline expectation for continued downward pressure on global equities remains intact. At the same time, we are seeing signs that the worst of the declines may be behind us as global cyclical Sectors show RS improvements while defensive Sectors display early signs of RS deterioration. In this report we review important technical levels for developed and EM indexes, and highlight a number of attractive opportunities across markets and sectors.
In this report we detail our U.S. investment thesis and provide a detailed technical appraisal of the broad market, as well as highlighting attractive investment opportunities within each of our 12 Sectors.
Holding floor support is vital for this trade to work. In absolute terms both APG and APC display similarly weak chart structures with risk of a final bout of weakness. APG displays a more depressed chart reading however.
In absolute terms we see Toyota Motor moving into a top while Tsuruha shows risk of a final low to work into this pair position but has a very compelling bullish chart set up as Toyota fade from resistance.
Descending price wedge has and will dominate tactical swing cycles on the way down with fresh evidence of a bearish flat maturing and a tactical negative to test the lower end of the descending range. DBS is knocking on fresh sell resistance currently.
Relative stance also shows continued deterioration versus the STI barring an upside break of pattern resistance. Expected bottoming cycle due in May 2019 followed by a perform into year-end.
Indicator bear divergences are being unwound but we are starting to see basing bull divergence form in the daily MACD cycle.
Get Straight to the Source on Smartkarma
Smartkarma supports the world’s leading investors with high-quality, timely, and actionable Insights. Subscribe now for unlimited access, or request a demo below.
Tactical buy supports are compelling for a bigger upside drive given the successful macro backswing support test and ascent that very often opens the way for the macro cycle to make headway, once a corrective cycle terminates. It is this corrective cycle that shows promise for an entry point.
Japan Post Holdings (JPH) does have a short history of volatile swings and will be the challenge within an ongoing basing cycle. We have well defined levels to trade this range tactically while aligning some strong risk pivot supports to reign in risk.
Macro pivot support will define the long term trend for JPH.
The weight of the evidence suggests that the pullback has begun. This belief is supported by overbought conditions combined with the S&P 500, MSCI ACWI, and nearly all Sectors hitting logical resistance. Assuming the pullback continues, the next question is how deep or damaging will it be? In this report we highlight various market/technical indicators we are monitoring, as well as pointing out attractive set ups within Consumer Discretionary and Health Care Sectors.
TSMC has struggled after breaking trend support last summer and from pressure stemming from the double top.
Underlying support is starting to take shape as the weekly cycle wrestles with a cycle trough amid a constructive descending wedge forming in the daily cycle. There are still a number of overhead hurdles to clear for a sustainable up cycle to resume. Current support is critical to hold as we hover just above this inflection point. A break below outlined support would take TSMC into a lower trading range.
Galaxy Entertainment Group (27 HK) exhibits some valid chart support in the form of a key low at 61.8% retracement and physical price support at the 40 level. This low should stay in place for 2019.
Price and RSI wedge formations are building steam for an upside breakout. MACD bull divergence and the triangle breakout back in November will provide forward upside energy. MACD triangles are some of the most powerful chart set ups.
Currently at an attractive risk to reward support zone for an entry with a reasonably tight stop.
68.30 long entry was recommended to close at the 77-80 area with 80 acting as the macro bull/bear line in our insight Ping An Long Pair Working – Risk of New Lows . The rejection call at 80 was expected to usher in selling pressure to press on new lows.
Ping An’s safe haven status has evaporated and does exhibit future vulnerabilities in HK’s underlying cycle (late Q1 into Q2). In our last insight we outlined that Ping An shows increasing risk that its safer have position will come under pressure and so it has.
New lows are still targeted. The current bounce is knocking on formidable resistance that should be used to sell stale long positions or even take a short bet.
Get Straight to the Source on Smartkarma
Smartkarma supports the world’s leading investors with high-quality, timely, and actionable Insights. Subscribe now for unlimited access, or request a demo below.
In absolute terms we see Toyota Motor moving into a top while Tsuruha shows risk of a final low to work into this pair position but has a very compelling bullish chart set up as Toyota fade from resistance.
Descending price wedge has and will dominate tactical swing cycles on the way down with fresh evidence of a bearish flat maturing and a tactical negative to test the lower end of the descending range. DBS is knocking on fresh sell resistance currently.
Relative stance also shows continued deterioration versus the STI barring an upside break of pattern resistance. Expected bottoming cycle due in May 2019 followed by a perform into year-end.
Indicator bear divergences are being unwound but we are starting to see basing bull divergence form in the daily MACD cycle.
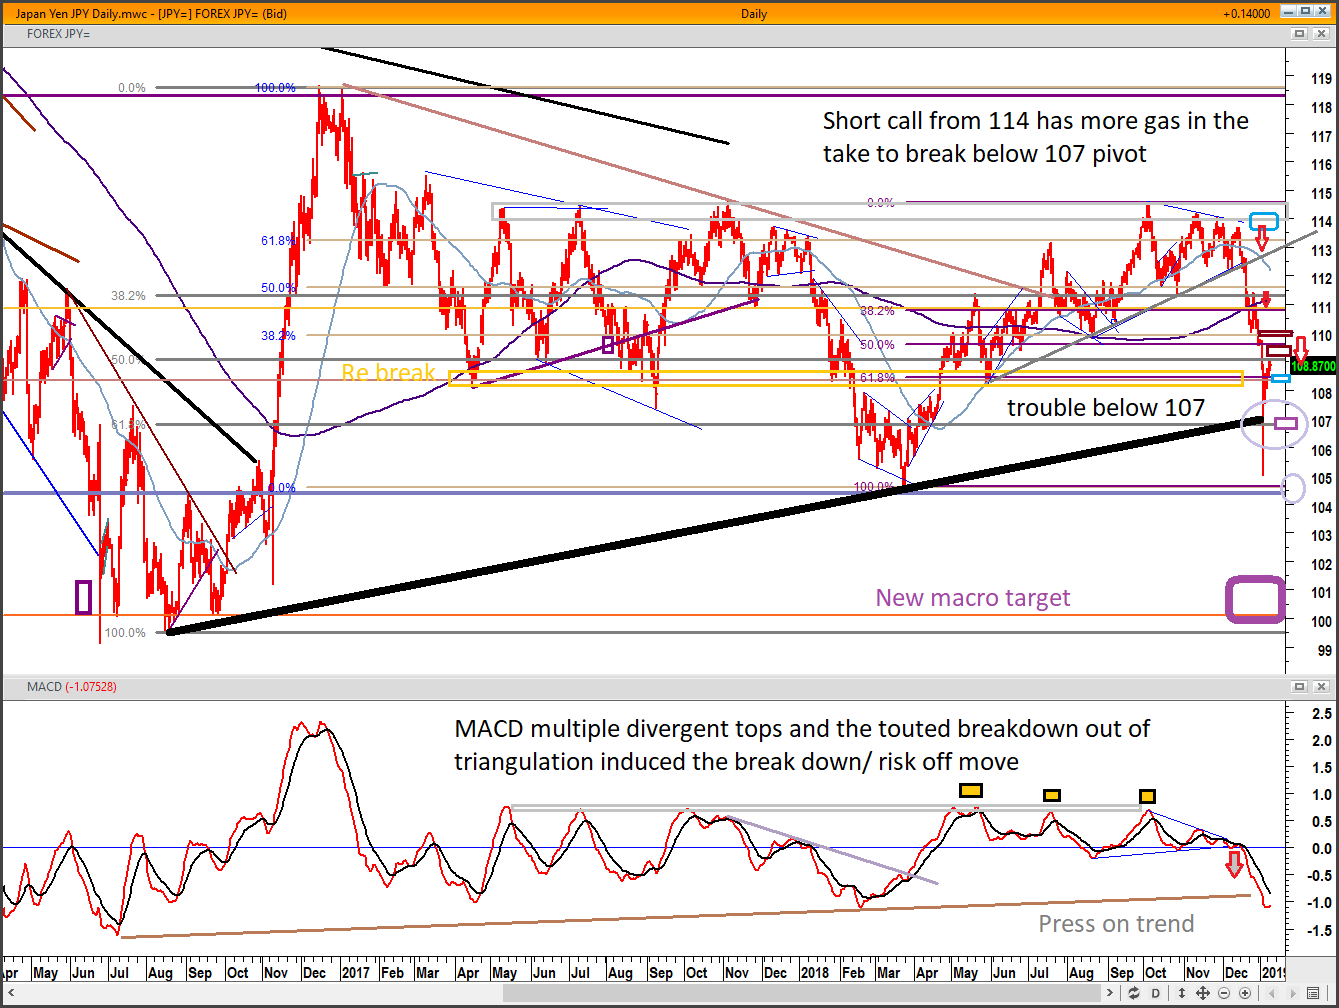
Major top and short call at USD/JPY 114 and flash decline did have a direct impact on a risk assets and the Nikkei in line with our S&P and Nikkei short calls. The second phase of USD/JPY weakness will usher in the next downturn in risk assets in late Q1 after some tactical posturing. We do view SPX 2,600 as a good level to re cycle shorts with some range work in store for February.
JPY crosses versus the AUD, GBP and Euro are currently nudging up against key resistance points that represent an interesting pivot point to stage a fresh decline (good risk aversion barometers).
We are seeing the knock on effect in Asian FX.
USD/JPY will surpass our original downside target of 108-109.
A combination of, optimism surrounding U.S.-China trade talks, and Fed Chairman Powell’s comments have led to a continuation of the oversold bounce which began on 12/26, and the S&P 500 is now trading just below the 12/19 pre-Fed rate hike area. ~2,350 on the S&P 500 remains the support level to monitor. A retest of this low remains the most likely scenario, though it is far from a guarantee due to the potential for a “V” reversal. We examine an array of factors leading to our intact cautious outlook, and highlight attractive set-ups within Consumer Discretionary and Health Care Sectors.
Samsung Electronics (005930 KS) bear call from 50k has rewarded with a series of short trades with the most recent short from 46k and has sliced through support at 39,500. Impulsive nature of the decline tell us a key low will take more time to take shape.
SEC is pressing on critical relative support versus the Kospi. A break would send ripples through the broader market in terms of the direction bias. Kospi has already spent far too much time below the macro pivot barrier at 272k for signs of any immediate recovery. Risk lies with a downside overshoot below 250 support for the Kospi.
SEC is completing a minute full wave count down that sets up a counter trend bounce which is tradable but the major low remains elusive. We outline probable downside targets in late Q1/Q2, upside cap into Q3 and the more strategic buy support.
Get Straight to the Source on Smartkarma
Smartkarma supports the world’s leading investors with high-quality, timely, and actionable Insights. Subscribe now for unlimited access, or request a demo below.
After an impulsive rise from the 110.5k dual bottom, Naver Corp (035420 KS) has formed a bull wedge that is expected to see a nice rally and perform over the Korean market.
RSI also shows a compelling set up for a rise.
Buy volumes are starting to improve and supportive.
Targets are 8% and 14% higher from current levels.
Macro pivot resistance will cap rally attermpts in Q1.
Japan bank index exhibits are very clear bearish head and shoulder pattern that broke neckline support and will offer a great short into a bounce for further weakness. This warns of further deterioration in the Nikkei post uptick.
Get Straight to the Source on Smartkarma
Smartkarma supports the world’s leading investors with high-quality, timely, and actionable Insights. Subscribe now for unlimited access, or request a demo below.
Descending price wedge has and will dominate tactical swing cycles on the way down with fresh evidence of a bearish flat maturing and a tactical negative to test the lower end of the descending range. DBS is knocking on fresh sell resistance currently.
Relative stance also shows continued deterioration versus the STI barring an upside break of pattern resistance. Expected bottoming cycle due in May 2019 followed by a perform into year-end.
Indicator bear divergences are being unwound but we are starting to see basing bull divergence form in the daily MACD cycle.
Major top and short call at USD/JPY 114 and flash decline did have a direct impact on a risk assets and the Nikkei in line with our S&P and Nikkei short calls. The second phase of USD/JPY weakness will usher in the next downturn in risk assets in late Q1 after some tactical posturing. We do view SPX 2,600 as a good level to re cycle shorts with some range work in store for February.
JPY crosses versus the AUD, GBP and Euro are currently nudging up against key resistance points that represent an interesting pivot point to stage a fresh decline (good risk aversion barometers).
We are seeing the knock on effect in Asian FX.
USD/JPY will surpass our original downside target of 108-109.
A combination of, optimism surrounding U.S.-China trade talks, and Fed Chairman Powell’s comments have led to a continuation of the oversold bounce which began on 12/26, and the S&P 500 is now trading just below the 12/19 pre-Fed rate hike area. ~2,350 on the S&P 500 remains the support level to monitor. A retest of this low remains the most likely scenario, though it is far from a guarantee due to the potential for a “V” reversal. We examine an array of factors leading to our intact cautious outlook, and highlight attractive set-ups within Consumer Discretionary and Health Care Sectors.
Samsung Electronics (005930 KS) bear call from 50k has rewarded with a series of short trades with the most recent short from 46k and has sliced through support at 39,500. Impulsive nature of the decline tell us a key low will take more time to take shape.
SEC is pressing on critical relative support versus the Kospi. A break would send ripples through the broader market in terms of the direction bias. Kospi has already spent far too much time below the macro pivot barrier at 272k for signs of any immediate recovery. Risk lies with a downside overshoot below 250 support for the Kospi.
SEC is completing a minute full wave count down that sets up a counter trend bounce which is tradable but the major low remains elusive. We outline probable downside targets in late Q1/Q2, upside cap into Q3 and the more strategic buy support.
After an impulsive rise from the 110.5k dual bottom, Naver Corp (035420 KS) has formed a bull wedge that is expected to see a nice rally and perform over the Korean market.
RSI also shows a compelling set up for a rise.
Buy volumes are starting to improve and supportive.
Targets are 8% and 14% higher from current levels.
Macro pivot resistance will cap rally attermpts in Q1.
Get Straight to the Source on Smartkarma
Smartkarma supports the world’s leading investors with high-quality, timely, and actionable Insights. Subscribe now for unlimited access, or request a demo below.
Japan bank index exhibits are very clear bearish head and shoulder pattern that broke neckline support and will offer a great short into a bounce for further weakness. This warns of further deterioration in the Nikkei post uptick.
Get Straight to the Source on Smartkarma
Smartkarma supports the world’s leading investors with high-quality, timely, and actionable Insights. Subscribe now for unlimited access, or request a demo below.
Major top and short call at USD/JPY 114 and flash decline did have a direct impact on a risk assets and the Nikkei in line with our S&P and Nikkei short calls. The second phase of USD/JPY weakness will usher in the next downturn in risk assets in late Q1 after some tactical posturing. We do view SPX 2,600 as a good level to re cycle shorts with some range work in store for February.
JPY crosses versus the AUD, GBP and Euro are currently nudging up against key resistance points that represent an interesting pivot point to stage a fresh decline (good risk aversion barometers).
We are seeing the knock on effect in Asian FX.
USD/JPY will surpass our original downside target of 108-109.
A combination of, optimism surrounding U.S.-China trade talks, and Fed Chairman Powell’s comments have led to a continuation of the oversold bounce which began on 12/26, and the S&P 500 is now trading just below the 12/19 pre-Fed rate hike area. ~2,350 on the S&P 500 remains the support level to monitor. A retest of this low remains the most likely scenario, though it is far from a guarantee due to the potential for a “V” reversal. We examine an array of factors leading to our intact cautious outlook, and highlight attractive set-ups within Consumer Discretionary and Health Care Sectors.
Samsung Electronics (005930 KS) bear call from 50k has rewarded with a series of short trades with the most recent short from 46k and has sliced through support at 39,500. Impulsive nature of the decline tell us a key low will take more time to take shape.
SEC is pressing on critical relative support versus the Kospi. A break would send ripples through the broader market in terms of the direction bias. Kospi has already spent far too much time below the macro pivot barrier at 272k for signs of any immediate recovery. Risk lies with a downside overshoot below 250 support for the Kospi.
SEC is completing a minute full wave count down that sets up a counter trend bounce which is tradable but the major low remains elusive. We outline probable downside targets in late Q1/Q2, upside cap into Q3 and the more strategic buy support.
After an impulsive rise from the 110.5k dual bottom, Naver Corp (035420 KS) has formed a bull wedge that is expected to see a nice rally and perform over the Korean market.
RSI also shows a compelling set up for a rise.
Buy volumes are starting to improve and supportive.
Targets are 8% and 14% higher from current levels.
Macro pivot resistance will cap rally attermpts in Q1.
Japan bank index exhibits are very clear bearish head and shoulder pattern that broke neckline support and will offer a great short into a bounce for further weakness. This warns of further deterioration in the Nikkei post uptick.
Get Straight to the Source on Smartkarma
Smartkarma supports the world’s leading investors with high-quality, timely, and actionable Insights. Subscribe now for unlimited access, or request a demo below.
A brief positioning sequence update as trade kicks off for 2019. Our S&P bounce sequence outlined after Christmas met our C wave target and now set for some tactical ranging before reach for new lows in Q1.
The fact that Asia could not must a rally on the back of the US 5% move higher on December 26th shed light on the bias this is resuming today after flat range patterns are breaking down.
Sell rallies remains our macro bias, however we see a tactical low shaping up next week in part of a range bounce flat pattern ahead of the bigger bear cycle due into late Q1.
Asia base case downside targets are outlined as well as fresh short resistance levels.
Get Straight to the Source on Smartkarma
Smartkarma supports the world’s leading investors with high-quality, timely, and actionable Insights. Subscribe now for unlimited access, or request a demo below.