In the semiconductor industry, particularly in the DRAM sector, there has been significant consolidation leading some to hypothesize that there’s now an oligopoly that will cause prices to normalize and thus end the business’ notorious revenue cycles. Here we will take a critical look at this argument to explain its fallacy.
In their public presentations, central banks seem to be contemplating the use of neutral interest rates (r*) in addition to unemployment/inflation theories. R* has the advantage of appearing to be subject to mathematical precision, yet it’s unobservable, and so unfalsifiable. Thus, it permits central banks to present any policy conclusion they want without fear of verifiable contradiction. R* is the policy rate that would equate the future supply of and demand for loans. It rises and falls as an economy strengthens and weakens. Long-term observation during the non-inflationary gold standard, period indicated that r* in an average economy was 2% plus, which would become 4% plus with today’s 2% inflation target. The Fed may soon end this tightening cycle with the fed funds rate at or near 2¾%, which would be r* if the rate of lending and borrowing in America remained stable thereafter. Rising (falling) lending would indicate a higher (lower) r*.
It was reported on January 3rd that Korean founder and heretofore effective controller of Nexon Co Ltd (3659 JP) Mr. Kim Jung-Ju and family, who exercise their ownership of Nexon through near 100% (98.64% according to Douglas Kim) control of NXC Corp (Korea) and NXC’s control of NXMH B.V.B.A (Belgium), planned to sell their stakes in NXC for up to 10 trillion won (US$8.9 billion).
Those two companies – NXC Corp (Korea) and NXMH (Belgium) – own 253.6mm shares and 167.2mm shares respectively, or direct and indirect ownership by NXC of just under a 48% stake in Nexon (3659 JP). Yoo Junghyun (Kim Jung-Ju’s wife) directly holds another 5.12mm shares at last look.
Nexon was founded in Korea in 1994 and moved its headquarters from Seoul to Tokyo in 2005, listing itself on the TSE in December 2011. The company is a well-known gamemaker (over 80 PC and online/mobile games), with famous games such as MapleStory, Dungeon & Fighter, and Counter Strike.
The Korea Economic Daily said in its report on the 3rd of January that Deutsche Bank and Morgan Stanley had been selected as advisors to run a sale process, and a formal non-binding offer to potential bidders was expected next month. A Korea Herald article suggested that “potential buyers, according to industry speculation, include China’s Tencent, Korea’s Netmarble Games, China’s NetEase and Electronic Arts of the US.”
The Big Question
In the second piece, Douglas Kim questions whether Kim Jung-Ju would sell NXC (and NXMH) as reported by the local press, or whether NXC and NXMH would sell their stakes in Japan-listed Nexon, the implication being that if they sold the stake in Nexon, it would mean buyers would get a large stake in a single company, whereas there is a bunch of other stuff floating around in NXC and its subsidiaries.
The other question is whether Tencent or another buyer buying NXC would trigger a mandatory Tender Offer for the shares in Nexon in Japan. The letter of the law in the TOB Rules changed a bit over 10 years ago would indicate not, but there are questions (and precedents) here.
HOYA Corporation is currently trading at JPY6,867 per share which we believe is fairly valued based on our SOTP valuation. The company operates with a few stable businesses and holds solid shares in the markets in which it operates. The company generates nearly 50.0% of its revenue from its core business of selling eyeglass lenses and contact lenses. The advancement in eyeglass and contact lenses technology, the growth in global population with vision-related issues due to increased use of PCs, smartphones and tablets and an ageing population will drive demand for eyeglasses and contact lenses. Although the company’s IT Segment which generates around 33.0% of company revenue is growing slowly, the management has aggressively managed the costs to improve the segment’s pre-tax profit margin to over 40.0%. While the Lifecare segment remains the engine of revenue growth for HOYA, it focuses on the IT segment for profitability. HOYA has grown its businesses, mainly the Lifecare segment through value adding M&A deals. The company has announced that it has entered into definitive agreements to acquire US-based Mid Labs and Germany-based Fritz by the end of FY19 (March 2019). The proposed acquisitions could help HOYA to expand its footprint in the global retinal market and further its Lifecare growth. The company has a strong balance sheet with a debt-to-equity ratio of 0.3% as of 2QFY19 with cash and cash equivalents worth JPY252.3bn (35.2% of total assets).
According to our analysis, HOYA operates solid businesses with impressive ROE and positive FCF, however, we believe, the market has already factored most of this into the share price. Therefore, we believe HOYA is worth looking at on the long side if its management continues to find value adding M&A deals which complement its existing lines of business or new business opportunities which would be transformative for HOYA. Our valuation is neutral, but we favour HOYA within the sector as it has held up relatively well despite the tech sell off due to its attractive health care business and shareholder friendliness which was perhaps underappreciated while the market was in its bull phase.
Get Straight to the Source on Smartkarma
Smartkarma supports the world’s leading investors with high-quality, timely, and actionable Insights. Subscribe now for unlimited access, or request a demo below.
In the three months to December, MonotaRO’s domestic (parent company) sales continued to grow at an annual rate close to 25%, indicating that full-year consolidated results should be close to management’s guidance and our own estimates. This also suggests that our 18% sales growth forecast for 2019 could be conservative.
Parent company data for December show sales up 18.4% year-on-year in nominal terms, but up 24.6% when adjusted for the number of working days in the month. The figures for November were 27.3% growth in nominal terms, but 21.3% adjusted.
In the three months to December, adjusted sales were up 24.2%, a slight improvement from 23.9% growth in 3Q. In FY Dec-18 as a whole, reported parent company sales were up 24.4% to ¥105.3 billion, slightly exceeding management’s ¥104.1 billion guidance.
At ¥2,523 (Friday, January 11, close), the shares have dropped 25% since October. They are now selling at 61x our EPS estimate for FY Dec-18, 54x our estimate for FY Dec-19 and 47x our estimate for FY Dec-20. Price/sales multiples for the same three years are 5.7x, 4.8x and 4.2x.
Consolidated results for FY Dec-18 are due to be announced by the end of January.
MonotaRO is the only pure-play e-commerce MRO (Maintenance, Repair and Operation) investment in the Japanese stock market. With over 10,000 SKUs (stock keeping units – i.e., individual items, including gloves, hand and power tools, hardware, painting supplies, etc.) for sale to construction companies, manufacturers, auto repair shops and other customers, the company is both driving and benefitting from the growth of Japan’s B2B MRO market. Overseas subsidiaries in South Korea, Indonesia and China, which account for about 4% of consolidated sales, are not yet profitable.
Accordia Golf Trust (AGT SP) has not been a great success story since its IPO in August 2014. The stock went to market at a unit price of 0.97 SGD and was recently traded at 0.53 SGD. If we include the dividends received since the IPO (0.2387 SGD) the ‘real‘ adjusted price is still only 0.76 SGD.
In the past we have attended several management meetings and the 2017 company AGM but were disappointed on multiple occasions by management that either 1) did not care, 2) did not know how or 3) was held back by other corporate Japanese factors from creating shareholder value.
Over the last six months several new developments are potentially creating a cocktail that could finally create sustained value for AGT unitholders:
Appointment of new CFO who assures investors no repeat of “membership deposit debacle”
New five-year funding secured from two lenders
MBK Partners buys ORIX Golf Management
Value investor Hibiki Path Advisors buys 6.2% of the company
Clear focus on acquisitions and using its balance sheet strength
With its 2019 financial year ending in March, investors can be hopeful that its dividend in FY20 can grow to a minimum of 5 SGD cents suggesting a yield of 9.5%. If management injects assets a higher DPU is possible.
In November 2017, Toshiba Corp (6502 JP) bowed to the inevitable and issued shares in order to shore up shareholder equity ahead of the 31 March 2018 deadline where if the company had not announced a positive shareholder equity number, it would have been delisted according to the Enforcement Rules of the Tokyo Stock Exchange.
So it issued ¥600 billion of equity in an accelerated privately-negotiated placement to hedge funds. There was some jawboning later from domestic institutions who had not gotten the show on the deal, but they would do well to remember that when Toshiba was in dire straits earlier that year, and continued listing was not guaranteed because of accounting issues which were later overcome (before the equity issuance), it was the hedge funds who bought dozens of percent of the company – not domestic financial institutions. In any case, the equity was predictably needed, but as a way of making it clear that it would not be forever, the release accompanying the financing said the company would accelerate returns to shareholders once the sale of Toshiba Memory Corporation was complete.
That return of capital to shareholders was announced in June 2018 after the closing of the TMC transaction had been confirmed. Toshiba would buy back ¥700 billion of shares. At the time, that was up to 40% of shares outstanding, but the shares rose as the shares of companies with large buyback plans do, and it took until November to dot the “i”s and cross the “t”s on making sure that the cash in the bank account was deemed distributable capital surplus. On November 8th, a year after announcing the sale of equity, Toshiba announced the start of a Very Large Buyback. A few days later the company announced a large ToSTNeT-3 buyback, offering to buy back all ¥700 billion of shares the following morning at that day’s close. A week later the company had bought back ¥243 billion or more than 35% of the total buyback then announced further purchases would be made in the market.
That’s when the fun began.
For previous recent treatment on the Toshiba buyback, see the following:
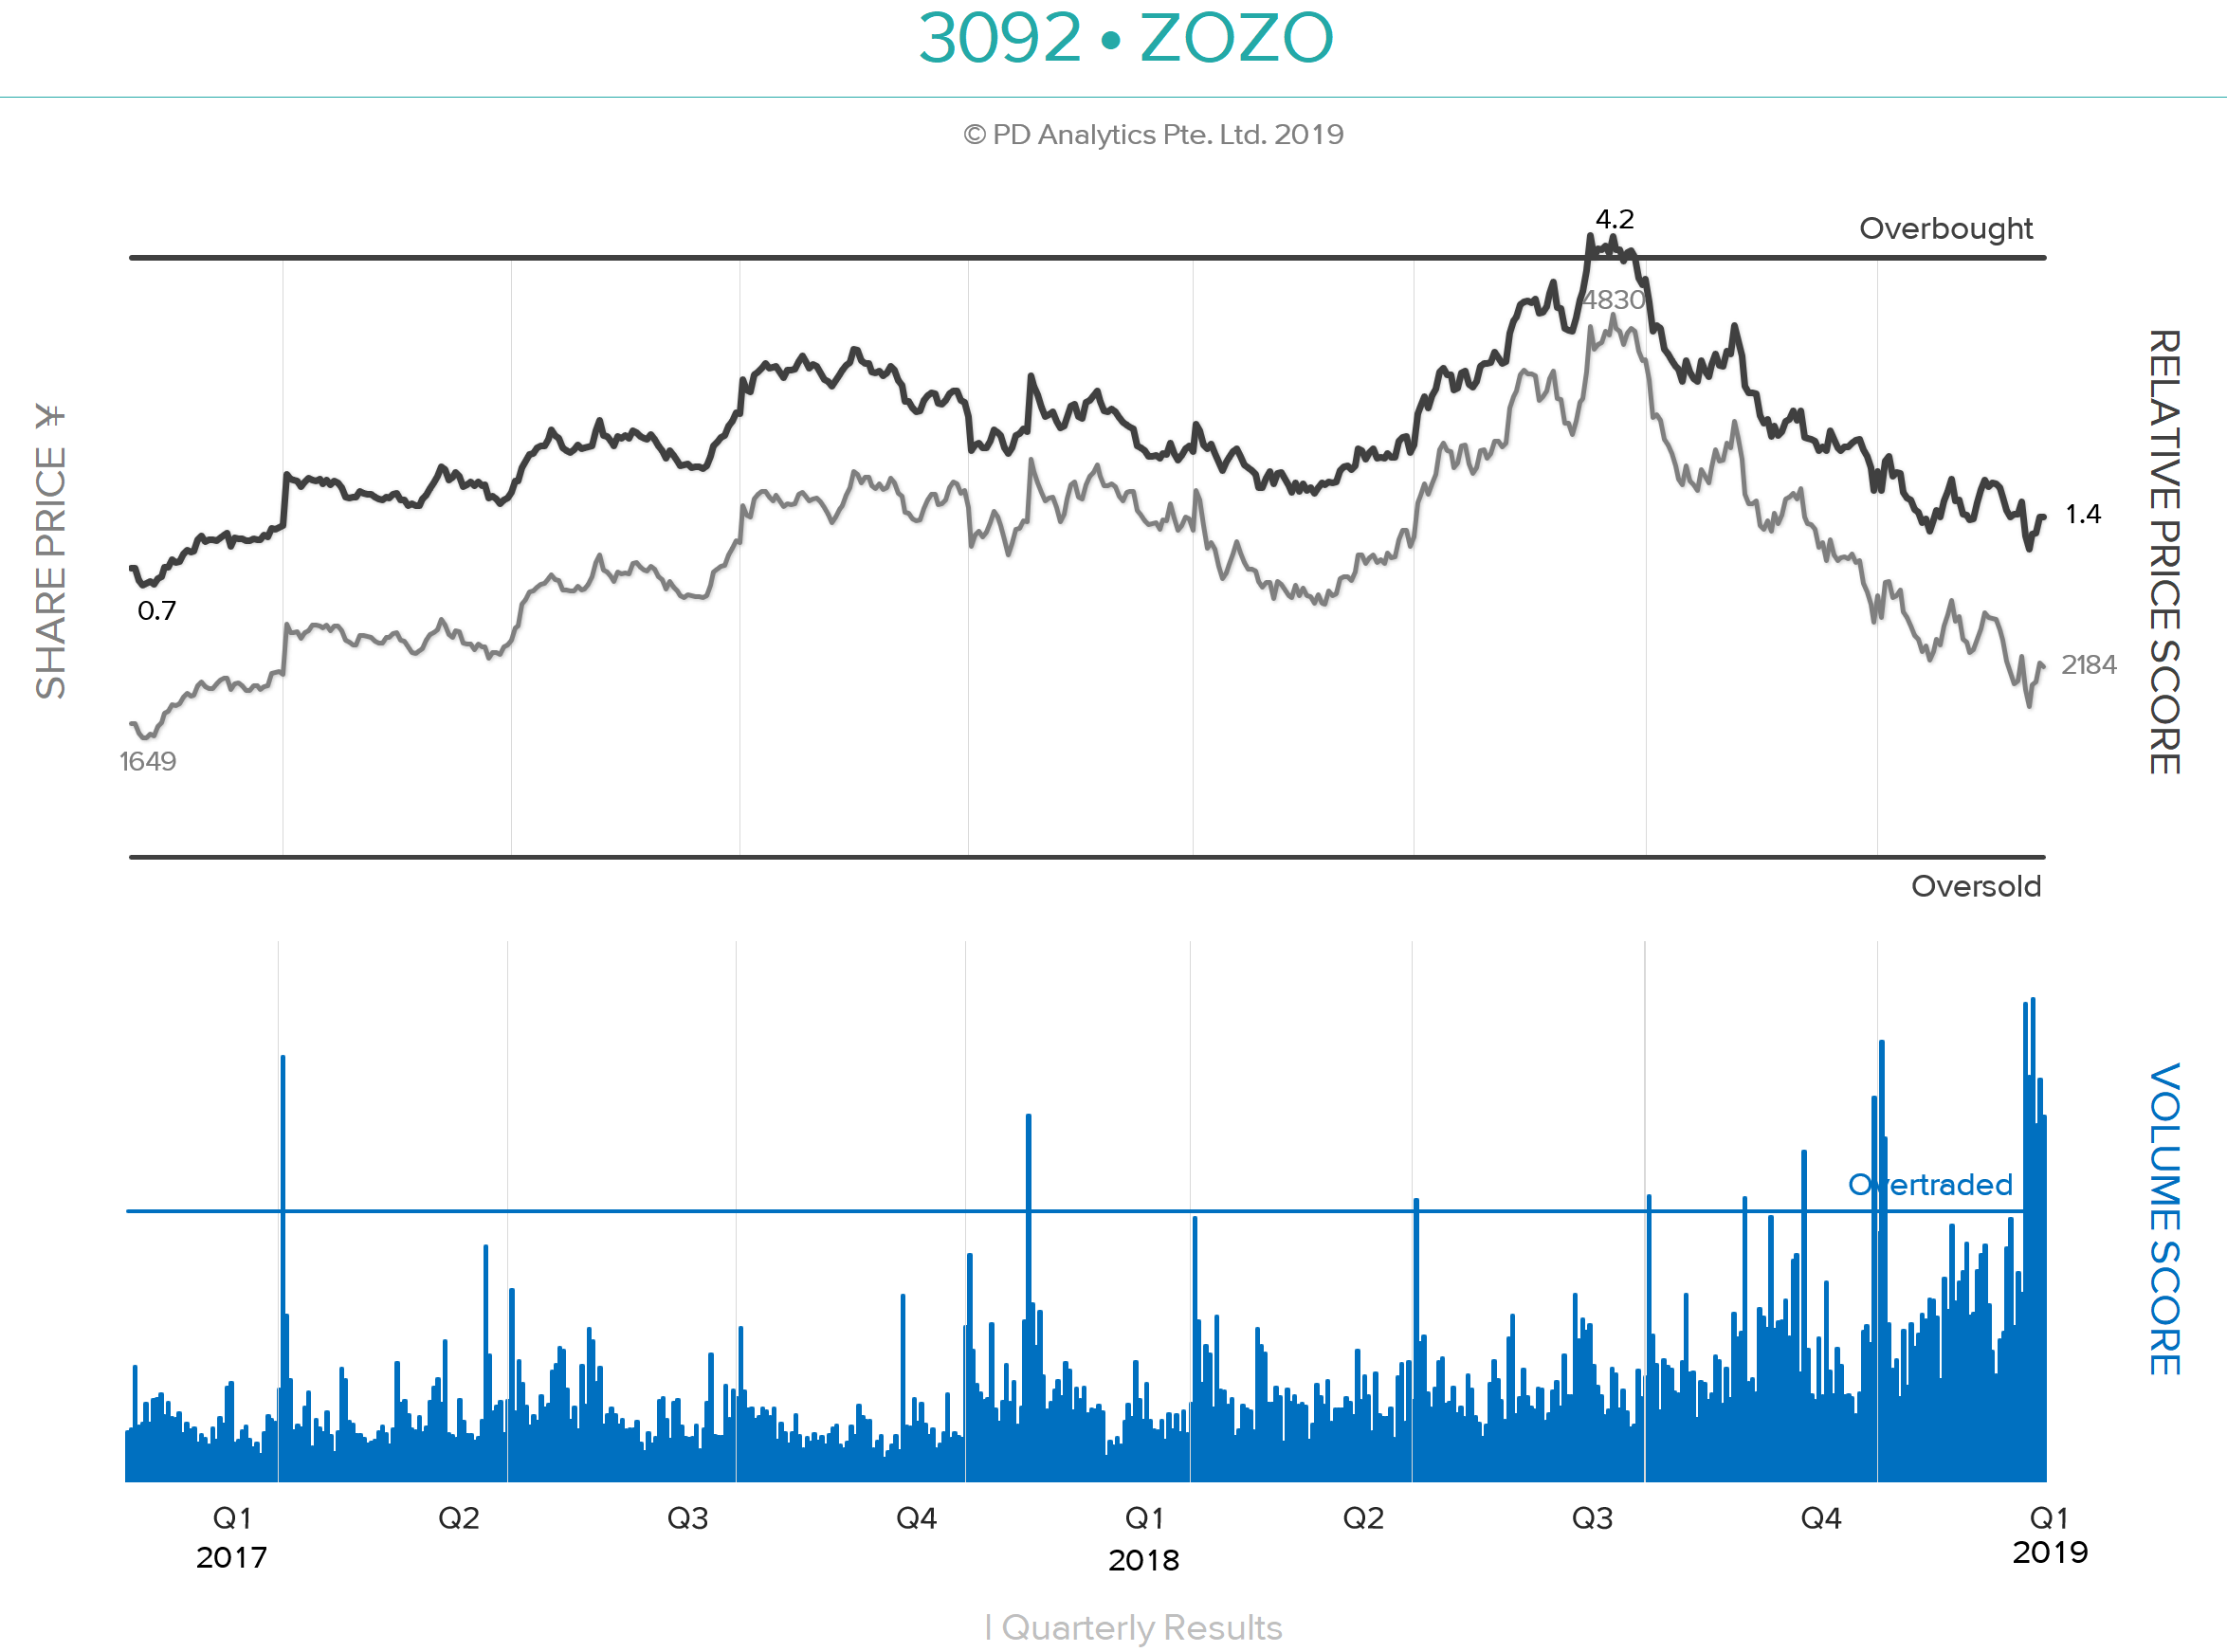
ONWARD AND OUT – ZOZO (3092 JP), formerly Start Today, has been the sixth-most-traded large capitalisation stock over the last ten trading days after Benefit One (2412 JP), Rizap (2928 JP), Takeda Pharmaceutical (4502 JP), Hoshizaki (6465 JP), and Workman Co Ltd (7564 JP). According to Nikkei XTECH, on 25th December apparel maker Onward (8016 JP) suspended selling of its products on ZOZOTOWN and will leave the platform altogether. Although Onward products are estimated to account for less than 3% of total transactions on the site, there are concerns that other apparel makers will follow suit as a result of the emerging direct competition on the site from ZOZO’s private label. Since reaching our 4.0 ‘Overbought’ threshold on 9th July 2018, ZOZO shares have corrected by 57% – the worst performance of any large cap from that date – as concerns mounted over the private brand strategy and the behaviour of CEO Yusaku Maezawa. Since bottoming on 4th January, the shares have risen by 18% following positive comments from the CEO about sales over the New Year holiday period.
PRIVATE-LABEL STRETCH GOALS– The ‘teething problems’ of ZOZO entering the private-label apparel business have been well-documented by Michael Causton in a recent Insight on Smartkarma. Michael rightly questions the feasibility of the company scaling a ¥200b apparel business within the next three years while targeting an additional incremental ¥400b in e-commerce revenue, particularly as it has taken ZOZO twenty years to reach the first ¥100b in annual revenues. In the DETAIL section below, we shall examine ZOZO’s current and possible future financial condition as it strives to become one of the top-ten global fashion retailers.
‘ZOSO’ & THE STAIRWAY TO HEAVEN – In addition to some notable purchases of modern art at record-breaking prices, CEO Maezawa also last year booked himself on Space X’s first flight to the moon. With apologies, the lyrics of the peerless song from Led Zeppelin’s untitled fourth album – known by fans as ‘Zoso’ after the symbol designed by Jimmy Page for the inner sleeve – come to mind:-
There’s a lad(y) who’s sure All that glitters is gold And (s)he’s buying a stairway to heaven When(s)he gets there (s)he knows If the stores are all closed With a word (s)he can get what (s)he came for.
We have received requests to provide a calendar of upcoming catalysts for near-term M&A, stubs and erstwhile event-driven names. Below is a list of catalysts over the near-term for such names as below. If you are interested in importing this directly into Outlook or have any further requests, please let us know.
Kind regards, Rickin Arun and Venkat
Get Straight to the Source on Smartkarma
Smartkarma supports the world’s leading investors with high-quality, timely, and actionable Insights. Subscribe now for unlimited access, or request a demo below.
2018 – TOP 30 PERFORMING LARGE CAPS – The best performing stock in Japan over the last twelve-months rose by an average of 49%, with three companies more than doubling. Only one traditional manufacturing company – Toyo Seikan (5901 JP) – features on a list otherwise led by Healthcare (5), Retail (3), Real Estate (3), Restaurants (3), Transportation (3), and Other Consumer Products (3). Two companies – Daikyo (8840 JP) and NTT Urban Development (8933 JP) are in the process of being acquired. Four companies are currently ‘Overbought (Relative Price Score >4), ‘Fully Priced’ and have a declining Results/Revision Score – Workman (7564 JP), Fancl (4921 JP), Systena (2317 JP), and Kikkoman (2801 JP), and are candidates for profit-taking/short selling, as are Goldwin (8111 JP) and Familymart Uny (8028 JP) based on their Relative Price Scores alone.
2018 – BOTTOM 30 PERFORMING LARGE CAPS – The worst-performing list is led by Machinery (8), Technology Hardware (6), and Electrical Equipment (3) sector companies. ‘Malfeasance’ is the thread connecting Suruga Bank (8358 JP), Tateru (1435 JP), Rizap (2928 JP), KYB (7242 JP), and Fujikura (5803 JP). Only seven companies on the list have positive Results/Revision Scores; the average one-year change in that score was -15. Seven of the top-ten declining stocks were loss-making as of the most recent trailing-twelve-months. Only one stock – Harmonic Drive Systems (6324 JP) remains ‘Fully Priced’ and only one – Hosiden Corp (6804 JP) – is now in our ‘Deep Value’ category.
In the DETAIL below, we review the outlier stock in terms of our Relative Price Score/Results & Revision Score matrix which highlights outliers in four categories – Peak Growth, Contrarian Sell, Contrarian Buy, and Ex-Growth/Turnaround – looking at the performance of 2018’s outliers as well as identifying each category’s current outliers. We conclude with tables of the best and worst performers in each of our thirty market sectors. We wish all investors in Japan ‘tight lines’ in 2019.
NOTES ON SCORING METHODOLOGY
The Results/Revision Score (RRS) is the average of the Japan Analytics’ Results Score and Forecasts/Revision Score for each company: –
The Results Score is calculated quarterly since 2008, using the most recent eight quarters of company data for revenues, operating income and operating margin and measure the rate, degree and consistency of change for each metric. The Results Score has a maximum of +30 and a minimum of -30 for each period.
The Forecast/Revision Score is based on Annual and Interim period company forecasts and compares changes from previous forecasts as well as against the trailing twelve-month (TTM) or previous first-half results, with annual forecasts being double-weighted. This score also has a maximum of +30 and a minimum of -30 for each period.
The Relative Price Score (RPS) measures the difference between the current relative share price and the mean absolute deviation of relative prices since listing which allows for a comparison of all companies on the same scale. Deviations in the top or bottom percentiles of historical observations of Relative Price Score are deemed to be ‘Overbought’ (OB) and ‘Oversold’ (OS), respectively. The company ‘thresholds’ are ‘+4’ for Overbought and ‘-2’ of Oversold.
Lastly, valuation ‘QUADrants’ group companies into the top and bottom 20% of TTM PER and PBR ranges and categorise outliers in both into four quadrants: “FP” = Fully Priced, “SP” = Speculative, “MT” = Mature and “DV” = Deep Value. “NE’ is assigned to companies which are loss-making in the most the recent trailing-twelve-month period.
Singapore telecom firm M1 announced on the 28th of December 2018 that Konnectivity Pte. Ltd. (a company jointly owned by Keppel Corp Ltd (KEP SP)and Singapore Press Holdings (SPH SP)) had made a Voluntary Conditional General Offer following the satisfaction of the pre-condition (IMDA approval) mentioned in the pre-conditional offer made in September.
The offer is to buy a minimum of 16.69% of the total share capital of M1 at a price of S$2.06 in order to increase the collective holding of the acquirer and its related parties from the current level of 33.32% to 50+% of FD shares. The Offerors will buy all shares tendered if they get to a minimum of 50+%.
The offer price of S$2.06 translated to a premium of 26.4% to the undisturbed price before the trading halt for the pre-conditional offer. At the time of writing, the stock is trading at S$2.08 which is higher than the proposed Offer Price, indicating the market is expecting a bump or an overbid.
M1 has seen ~175mm shares traded since the initial announcement – all at prices above the proposed Offer Price of S$2.06. In that time, Starhub has popped and fallen back, and SingTel has fallen almost 10% to its lowest level in seven years.
Clearly, there is expectation that either Axiata will counter or Keppel and SPH will raise the Offer to bring Axiata onside. Travis Lundy doesn’t see who would join Axiata in bidding for M1 at a price of 8+x TTM EBITDA when there is price competition to come. He thinks it more likely that a small kiss (perhaps even a decent bump to S$2.30 or even more) to the price is made by the Offerors SPH and Keppel to get Axiata over the line. However, he does not think the Offerors need to offer that much to dislodge retail shareholders if the IFA comes out and says “increased competition puts the dividend in danger“.
Healius, a leading Australian owner of GP clinics and pathology centres, announced an unsolicited and conditional proposal from Jangho Group Co Ltd A (601886 CH) for A$3.25/share (~9.6x FY19 EV/EBITDA) in a A$2.0bn deal. Jangho currently holds a 15.9% stake in Healius and could potentially go hostile here.
Pricing looks off according to Arun George, at a 15% discount to peers on a CY2019 EV/EBITDA metric.
Still, Healius is not without issues, having to pay a backpay bill to staff last year, bump salaries for workers at its Victorian pathology division, while also losing a lucrative national bowel screening contract in 2017.
Notwithstanding the price, as Healius is an owner of sensitive medical data, the FIRB would take a very close look at this transaction, especially one where the acquirer is a Chinese entity, given the recent rejection of the CKI/APA Group (APA AU) deal and Huawei’s 5G.
As the merger between TMB and Thanachart gets a nudge from the Ministry of Finance and could be finalized this month, Athaporn Arayasantiparb, CFA tackles the obvious questions – what price and what benefits?
Based on his estimates, the potential improvements in ROE from the merger and potential divestment of Thanachart’s 19% stake in MBK, he thinks it justifies a Bt11.1/sh premium or Bt64.25/sh. Anything above that would feasibly be value destroying.
In terms of benefits, Thanachart has a higher ROE than TMB and appears smaller but better managed. The merger would allow TMB to re-enter the securities business (more cross-selling), enlarge its asset management franchise, and scale up the deposit base for both banks.
Reportedly Nexon’s founder Kim Jung-Joo and other related parties plan to sell their 98.64% stake in NXC Corp, which owns a 47.98% stake in Nexon. Nexon has a market cap of $11.6bn but the rumoured price tag for the 47.98% take is $8.9bn implying a significant management premium.
Initially launched as a voluntary conditional Offer late November, DNO ASA (DNO NO)crept over 30% in Faroe this week and is now required to launch an MGO. The Offer price remains the same at GBP 1.52/share, however, the acceptance condition falls to 50% from 57.5% previously.
Faroe’s pushback on the Offer – that the 21% premium offered to pre-announcement price is only “about half the average premium paid on all UK takeovers over the last 10 years” – is disingenuous. DNO built a 27.68% stake in a matter of days back in April 2018, clearly telescoping that a full-blown Offer was a possibility (although denying it at the time). The unaffected price prior to the acquisition of that stake should be used as a reference point for the current Offer. This translates to a 44.8% premium.
DNO has 43.1% in the bag, close to the 50% needed. There are investors (like Cavendish, holding 1.38%) who side with Faroe saying that the Offer is too low. With shares trading through terms, my bet is that DNO may need to kiss this offer, say 5-10%, to get it over the line.
Curtis Lehnert recommends closing out the set-up trade, now that he sees the stub having reverted to its long-term average level. Since his recommendation, the trade has made a notional gain of 5% in a two and a half month time span. As an aside I back out a discount to NAV of 21%, off its recent low of ~28% in early Nov, and compares to a 12-month average of 19%.
Back in September, I discussed in StubWorld: Matheson Unloads JLT, Unwind Takarathat Matheson may use the net proceeds of £1.7bn (US$2.2bn) from selling its 40.16% stake in Jardine Lloyd Thompson Group P (JLT LN)into Marsh & Mclennan Cos (MMC US)‘sOffer, towards increasing its stake in JS, as there was/is still some room before the maximum 85% ownership level was reached. This is what happened (or at least a token amount of the proceeds), with Matheson buying ~2.5mn shares in Strategic for ~US90mn in early October. Matheson now holds a little less than 84% by my calculation – the group unhelpfully states it holds 84% without going into decimal places.
After touching a 17-year low ratio level of 1.41x (JM/JS) last September, that has blown out to 1.83x, having closed the year at 1.89x, a two-and-a-half year high, and compares to the long-term average of 1.7x.
Strategic continues to trade “cheap” at ~44% discount to NAV, adjusted for the cross-holding. The spread between Matheson and Strategic is around its widest inside a year. Furthermore, as Matheson increased its stake, Strategic also acquired shares in Matheson earlier last year. Both elevate the cross-holding, which in principle you would expect the two companies to become even more closely aligned.
I’d recommend buying into Strategic for its attractive NAV discount and further share acquisitions from Matheson.
Stub Wrap
Using a basket of 40 Holdcos I constructed, the average NAV discount in 2018 steadily widened throughout the year. Elsewhere:
Passive, tech-related and illiquid Holdcos widened most; while cross-border and property Holdcos were the best of the worst.
Illiquid, property, and passive Holdcos’ underperformance (or widening) was more pronounced in the first half. Tech Holdcos primarily widened in the second half.
My ongoing series flags large moves (~10%) in CCASS holdings over the past week or so, moves which are often outside normal market transactions. These may be indicative of share pledges. Or potential takeovers. Or simply help understand volume swings.
Often these moves can easily be explained – the placement of new shares, rights issue, movements subsequent to a takeover, amongst others. For those mentioned below, I could not find an obvious reason for the CCASS move.
This is the time of year that Objective Analysis releases its semiconductor forecast. This post is based upon a video posted on the WeSRCH website that explains the Objective Analysis 2019 semiconductor forecast.
Although accurate semiconductor forecasts are straightforward to produce, the consistently-accurate methodology spelled out in this Insight is rarely used.
The forecast predicts that the downturn that the industry is currently entering will be longer than most, with profits eluding chip companies until 2022.
A Nikkei Asian Review article on 21 December titled Tokyo Stock Exchange’s big board about to get a lot smaller suggesting the TSE would boot up to 1500 stocks from TOPIX, which now boasts 2130+ members – far more than major indices in other developed markets.
Since November, a dedicated internal panel (“Advisory Group to Review TSE Cash Equity Market Structure”) has been addressing the issues, trying to make Tokyo’s stock market more attractive for international investors. Some of the proposals raised include a market cap cutoff of ¥50 billion or ¥100 billion of which there were on that date 1,000 companies and 620 companies respectively.
The introduction makes clear the goal. The part below is underlined in the original document.
Taking into account the role the market structure plays, it is important that TSE reviews the market structure in order to further incentivize listed companies to proactively improve their overall value as corporation, in addition to further attracting diverse global and domestic investors by providing attractive investment opportunities. Conducting a review of the market structure, with the aim of supporting the se roles, will further contribute to the development of a sustainable capital market, and by extension, the wider Japanese economy.
That paragraph tells you all you need to know.
It Has Been Decided That Something Must Be Done So Something Will Be Done.
The Consultation Paper and the Data presentation accompanying it discuss the current market structure (with four “listing” markets including the TSE1, TSE2, MOTHERS, and JASDAQ (including sub markets), making it clear that…
biotech companies which need R&D capital should be allowed to list in order to raise capital, but pointing out that small companies which are already in existence for many years which list just because they want to are not
the requirements for reassignment from JASDAQ, MOTHERS or TSE2 to the First Section (the “step-up market” to which all major companies should aspire) are too low, and many companies which should not be admitted to the top ranks because of weak internal management structure or corporate governance end up there anyway,
delisting requirements and procedures may not function properly and should be reviewed,
the ability for shareholders to trade the “pink sheets”, “green sheets”, or delisted stocks is insufficient.
the requirements for listing and liquidity on JASDAQ are insufficient.
I would note that the Consultation Paper does not address the ¥50 billion or ¥100 billion question. The fact that the Nikkei does so tells you where they want to go with this.
The TSE is not suggesting that small companies shouldn’t be allowed to list.
The TSE clearly defines three types of companies – 1) risky companies without profits but great need for capital to grow, 2) established companies where capital need is lower and market investment may be made by more risk-averse investors, and 3) the “step-up market” – the big leagues.
The Paper asks investors what should be the listing criteria for each group and the treatment of those companies which no longer meet the listing criteria. Then it asks about delisting criteria.
Effectively, the goal of making such changes to minimum market cap would be to…
make TOPIX (which is an index consisting of all members of the TSE First Section) a “better” index which would look more like the S&P500. That would make TOPIX more like the indices commonly used by foreign investors – such as MSCI Japan and FTSE Japan.
provide two markets for smaller companies – one for growth companies without profits or track record and one for established companies with a track record.
The “Call for Comment” questions in each section point you to the overall conclusions and destination and ask you, the investor, what limits should be placed to light the way there. Investors with an interest in market structure should think about how best to respond.
Should parent-controlled subsidiaries be allowed to list when the parent owns more than 50%?
Should all TSE1 companies be required to release extensive company data and documentation online? in English?
Should companies which breach the public trust through scandal – such as Seibu Rail, Kanebo, and Olympus years ago or Toshiba more recently – be permitted to stay listed? (Seibu and Kanebo were delisted, Olympus and Toshiba stayed listed)
What constitutes a situation where delisting should be mandatory?
The language of the Paper and the way the Call for Comment questions are framed tells me the “results” are already known and the results of the Public Comment period will simply be flavoring.
There will be a three-tier market – something akin to MOTHERS, something akin to TSE2 for “established companies”, and something like the TSE First Section which will be beefed up (stricter criteria) and slimmed down (fewer companies).
Whether governance is improved through limits on subsidiary holdings by parent companies, or criteria for independent directors, or more extensive documentation (and in English) is up to investors. If they make enough noise, this could happen.
Most important for traders and investors are the market impacts from potential changes to TSE First Section. If the TSE mandates that listing requires companies to have a market cap of ¥100 billion, the change…
will have a profound effect on the supply/demand metrics for a large number of companies. THAT will create dislocations.
possibly prompt consolidation over time. The limited ability of small companies to access TSE1 listing because of insufficient size or dollar value of daily liquidity may cause mergers.
could have profound effects on the Nikkei 225 if done right.
ROUND TRIP – Temporary staffing company Pasona (2168 JP)‘s shares have completed a year-long ’round trip’ after reaching Overbought territory one year ago following the launch of an ‘engagement campaign’ by the activist investor, Oasis. In May 2018, the company took advantage of its elevated share price to sell 2.3m shares (of which 2m were Treasury Shares), prompting a sharp correction in the share price. In recent months, the shares have languished as the company’s business performance has begun to deteriorate, reaching an 18-month low of 1,008 on 25th December, before rebounding 12% to close the year at ¥1,126.
HOLDCO DISCOUNT – According to the Smartkarma HoldCo Monitor, Pasona has the largest ‘ListCo as a % of Market Cap’ percentage at 365%, and the second-largest ‘Discount to Net Asset Value’ (78%) of the 77 companies that are tracked. With Pasona’s interim results due to be released on Friday 11th, January, the Insight will look at the company’s recent business performance, offer some guidelines for valuing the company and make two stock-specific recommendations. The format follows that of our recent Insight on GMO Internet.
Get Straight to the Source on Smartkarma
Smartkarma supports the world’s leading investors with high-quality, timely, and actionable Insights. Subscribe now for unlimited access, or request a demo below.
The Japanese telecom market was more volatile in 2018 than anticipated. However, Chris Hoare remains broadly positive on the sector for 2019. While pressure on the revenue line is intensifying, we do do not expect a price war to break out. In fact, we look for volatility to ease as the year progresses. Operators point to opex reductions and handset subsidy reductions to offset revenue weakness. We think that earnings are likely to surprise on to the upside. Over time we also look for dividend payout ratios to gradually rise, with the Softbank Corp (9434 JP) (KK) listing the long term catalyst. For Softbank Group (9984 JP) (SB) we look for market confidence to improve on the Vision Fund strategy, as profitable exits/up-valuations of assets such as Uber are announced.
The sector is recovering from NTT Docomo’s (9437 JP) price cut announcements but we don’t think they will slash prices (cuts will be selective). Our top pick is now KDDI (9433 JP) which could actually benefit from Rakuten’s (4755 JP) entry (as the roaming partner). DoCoMo is most affected but there are plenty of cost cutting opportunities. NTT (Nippon Telegraph & Telephone) (9432 JP) has optimistic guidance with substantial opex and capex cost cuts planned. Our order of preference for the stocks is now: KDDI (Buy), followed in order by NTT (Buy), SB Group (Buy), DoCoMo (Buy) and SB Corp (Neutral). We do not currently cover Rakuten.
The year 2018 was not the brightest for cryptocurrencies; Bitcoin (XBTUSD CURNCY) fell around 70% during 2018 and top altcoins like Ethereum (ETH BGN CURNCY), Ripple and Bitcoin Cash were also down around 80%, 85% and 95% respectively during last year. While it is difficult to pinpoint a single reason for this, a number of factors including, rising security concerns, increased scrutiny, failed institutional support and Bitcoin Cash hash wars have collectively contributed to this bearish sentiment in the cryptocurrency markets last year.
In this note we take a look at several top cryptocurrency and blockchain developments from last year, to see how they would fare going into 2019.
This is a collaborative report between Douglas Kim and myself.
Global and Asia headwinds still rattle the gaming sector, but these three companies remain undervalued despite market sentiment.
Macau’s solid year end performance continues to defy projections, producing a 14% y/y GGR increase.
Galaxy will benefit disproportionately from the HKMB bridge traffic growth, MGM’s single digit market share will ramp up to double digits and Nagacorp may be the single most siloed gaming operator in all of Asia.
We are once again turning negative on Softbank Corp (9434 JP) as the stock price is now 18% above the ¥1,200 level which we mentioned looked cheap, outperforming Topix by 20% and the Nikkei by 21%.
In our view this IPO was oversold and probably to numerous weak hands who may now be looking at the large price drops that Softbank Group has occasionally suffered. We would hazard a guess that many of the individuals looking to flip the shares may still not have sold, however, if the stock dips below ¥1,200 we believe risk-reward would tilt positive until the passive buying is complete. Our view on this large drop is mostly that Softbank over-reached in terms of the size of the sale and the valuation.
The business, while subject to various headwinds should still be highly cash generative and at the current price is on just under 13x EV/OP. That’s not particularly cheap but nor is it ridiculously expensive if you believe OP will not drop (we believe it will). With a bit more of a discount and once the initial selling pressure from flippers dies down we believe the yield and passive buying should help the stock find a temporary floor. We do not view this as an attractive long-term holding in any way shape or form, but as a short-term trade the potential to make a 5-10% return on the back of a bounce following panic selling by retail supported by the yield and passive buying seems reasonably good.
Prior to that, we had flagged that retail demand for the IPO could be fragile in Softbank IPO: Signs Point to Risk of Early IPO Price Break and while there was a stronger sell-off than we expected immediately post listing, we would hazard a guess that there could still be an overhang close to the IPO price as there could be significant latent sell volume from retailers hoping to break-even and if that opportunity opens up in a weak market we believe many could choose to sell despite the rebound.
We would point to the news today regarding Softbank Group lowering its planned investment in WeWork from $16bn to just $2bn due to investors in the Vision Fund balking. As perhaps the most aggressive tech investor of the last few years, Softbank stepping back is not a good sign overall and raises questions about the viability of the valuations that other companies in its investment portfolio, namely Uber, are targeting for their upcoming IPOs. With news sources suggesting that Softbank Group is also looking to offload its Nvidia Corp (NVDA US) stake, the tide appears to have truly turned for tech in general and the chronically unprofitable platform companies such as Uber and WeWork in particular.
This raises the governance risks we initially highlighted regarding the use of Softbank Corp for funding the overall Softbank Group. As such, despite a final round of passive buying for Topix buying at the end of the month, the stock price looks vulnerable here.
Please see some recent buy ideas, all very cheap, that we believe offer decent longer term growth and have had a dreadful December. We have written on all recently and below is a summary of the main points as well as an some valuation metrics. All are sensibly priced in our view now.
Get Straight to the Source on Smartkarma
Smartkarma supports the world’s leading investors with high-quality, timely, and actionable Insights. Subscribe now for unlimited access, or request a demo below.
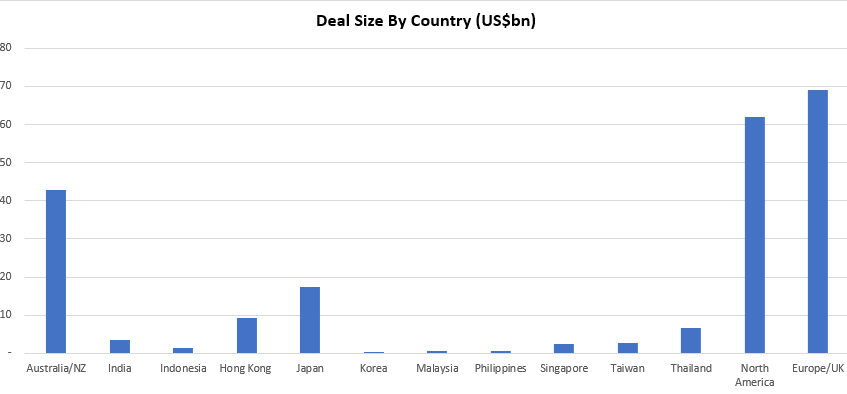
This insight briefly summarises the 93 M&A transactions, with a collective deal size of ~US$215bn, published on Smartkarma in 2018.
Transactions discussed were typically Asia-Pacific-centric or concerned an outbound transaction initiated from an Asia-Pacific-listed company. The majority of these deals involved a market cap/deal size in excess of US$100mn.
During the year a number of large, high profile transactions were completed that were also extensively analysed and discussed on Smartkarma. However, if the initial discussions between the two parties (acquirer & target) took place pre-2018, they are not included in the charts above. A selection of these include (in no particular order):
You might be surprised to learn that in the ten years to 2017 Asia has outperformed advanced economies. Despite extraordinary monetary and fiscal stimulus and the damaging dollar-demand deflationary policies of the ECB, BoJ and BoE, the region is 188% larger in US dollar terms compared with 2007 while US dollar GDP per capita income is 170% higher. The parallel numbers for the advanced countries – the US, euro-area and Japan combined- are 19% and 13%. Asian stock markets have underperformed since 2010 but we believe that investors are still to fully acknowledge Asia’s strong growth fundamentals. Combined with cheap valuations there is significant upside for Asian equity markets.
Japan bank index exhibits are very clear bearish head and shoulder pattern that broke neckline support and will offer a great short into a bounce for further weakness. This warns of further deterioration in the Nikkei post uptick.
We analyse the holdings of the world’s largest banks by the 255 global equity funds in our analysis. For each region (America/EMEA/Asia), we have selected the 6 largest banks by total assets, as defined by the S&P Global Market Intelligence Report, 2018.
We find that overall, holdings in these banks are on the decline, and in some cases, investor flight has been acute. Only 2 of the 18 banks are held overweight by global investors, with Citigroup Inc (C US) and Bnp Paribas (BNP FP) seeing the biggest exodus through 2018.
Get Straight to the Source on Smartkarma
Smartkarma supports the world’s leading investors with high-quality, timely, and actionable Insights. Subscribe now for unlimited access, or request a demo below.
The Semiconductor Industry Association (SIA) just announced that worldwide sales of semiconductors reached $41.4 billion for the month of November 2018, an increase of 9.8% YoY, but down 1.1% MoM, the first such decline since February 2018. While the decline is modest and total 2018 total semiconductor sales are on track to reach ~$470 billion for a YoY increase of 15.7%, any decline in what should be peak holiday season is not a good sign.
Semiconductor sales historically track Wafer Fab Equipment (WFE) sales with a roughly six month time lag. North American WFE sales have been declining each month for the past six months meaning that this latest semiconductor MoM sales decline is right on schedule.
Leveraging a decade’s worth of historical data, we analyse two key questions that are likely on every investors mind. Firstly,for how long should we expect semiconductor sales to continue their decline. Secondly, how steep should we expect that decline to be?
Get Straight to the Source on Smartkarma
Smartkarma supports the world’s leading investors with high-quality, timely, and actionable Insights. Subscribe now for unlimited access, or request a demo below.
In their public presentations, central banks seem to be contemplating the use of neutral interest rates (r*) in addition to unemployment/inflation theories. R* has the advantage of appearing to be subject to mathematical precision, yet it’s unobservable, and so unfalsifiable. Thus, it permits central banks to present any policy conclusion they want without fear of verifiable contradiction. R* is the policy rate that would equate the future supply of and demand for loans. It rises and falls as an economy strengthens and weakens. Long-term observation during the non-inflationary gold standard, period indicated that r* in an average economy was 2% plus, which would become 4% plus with today’s 2% inflation target. The Fed may soon end this tightening cycle with the fed funds rate at or near 2¾%, which would be r* if the rate of lending and borrowing in America remained stable thereafter. Rising (falling) lending would indicate a higher (lower) r*.
It was reported on January 3rd that Korean founder and heretofore effective controller of Nexon Co Ltd (3659 JP) Mr. Kim Jung-Ju and family, who exercise their ownership of Nexon through near 100% (98.64% according to Douglas Kim) control of NXC Corp (Korea) and NXC’s control of NXMH B.V.B.A (Belgium), planned to sell their stakes in NXC for up to 10 trillion won (US$8.9 billion).
Those two companies – NXC Corp (Korea) and NXMH (Belgium) – own 253.6mm shares and 167.2mm shares respectively, or direct and indirect ownership by NXC of just under a 48% stake in Nexon (3659 JP). Yoo Junghyun (Kim Jung-Ju’s wife) directly holds another 5.12mm shares at last look.
Nexon was founded in Korea in 1994 and moved its headquarters from Seoul to Tokyo in 2005, listing itself on the TSE in December 2011. The company is a well-known gamemaker (over 80 PC and online/mobile games), with famous games such as MapleStory, Dungeon & Fighter, and Counter Strike.
The Korea Economic Daily said in its report on the 3rd of January that Deutsche Bank and Morgan Stanley had been selected as advisors to run a sale process, and a formal non-binding offer to potential bidders was expected next month. A Korea Herald article suggested that “potential buyers, according to industry speculation, include China’s Tencent, Korea’s Netmarble Games, China’s NetEase and Electronic Arts of the US.”
The Big Question
In the second piece, Douglas Kim questions whether Kim Jung-Ju would sell NXC (and NXMH) as reported by the local press, or whether NXC and NXMH would sell their stakes in Japan-listed Nexon, the implication being that if they sold the stake in Nexon, it would mean buyers would get a large stake in a single company, whereas there is a bunch of other stuff floating around in NXC and its subsidiaries.
The other question is whether Tencent or another buyer buying NXC would trigger a mandatory Tender Offer for the shares in Nexon in Japan. The letter of the law in the TOB Rules changed a bit over 10 years ago would indicate not, but there are questions (and precedents) here.
HOYA Corporation is currently trading at JPY6,867 per share which we believe is fairly valued based on our SOTP valuation. The company operates with a few stable businesses and holds solid shares in the markets in which it operates. The company generates nearly 50.0% of its revenue from its core business of selling eyeglass lenses and contact lenses. The advancement in eyeglass and contact lenses technology, the growth in global population with vision-related issues due to increased use of PCs, smartphones and tablets and an ageing population will drive demand for eyeglasses and contact lenses. Although the company’s IT Segment which generates around 33.0% of company revenue is growing slowly, the management has aggressively managed the costs to improve the segment’s pre-tax profit margin to over 40.0%. While the Lifecare segment remains the engine of revenue growth for HOYA, it focuses on the IT segment for profitability. HOYA has grown its businesses, mainly the Lifecare segment through value adding M&A deals. The company has announced that it has entered into definitive agreements to acquire US-based Mid Labs and Germany-based Fritz by the end of FY19 (March 2019). The proposed acquisitions could help HOYA to expand its footprint in the global retinal market and further its Lifecare growth. The company has a strong balance sheet with a debt-to-equity ratio of 0.3% as of 2QFY19 with cash and cash equivalents worth JPY252.3bn (35.2% of total assets).
According to our analysis, HOYA operates solid businesses with impressive ROE and positive FCF, however, we believe, the market has already factored most of this into the share price. Therefore, we believe HOYA is worth looking at on the long side if its management continues to find value adding M&A deals which complement its existing lines of business or new business opportunities which would be transformative for HOYA. Our valuation is neutral, but we favour HOYA within the sector as it has held up relatively well despite the tech sell off due to its attractive health care business and shareholder friendliness which was perhaps underappreciated while the market was in its bull phase.
The ability to have stable prices has great value.
According to Edward Gibbon, the decaying Roman Empire exhibited five hallmarks: 1) concern with displaying affluence instead of building wealth; 2) obsession with sex; 3) freakish and sensationalistic art; 4) widening disparity between the rich and the poor; and 5) increased demand to live off the state. Most DMs and many EMs display similar symptoms today because fiscal and monetary policies, the foundation of both ancient and modern societies, are identical: increasing welfare outlays by artificially inflating the money supply. The Roman Empire took more than four centuries to destroy what the Republic had built in the previous five centuries because clipping and debasing coins inflated currency supplies slowly. Entering debits and credits in the books of commercial and central banks is much more efficient.
Get Straight to the Source on Smartkarma
Smartkarma supports the world’s leading investors with high-quality, timely, and actionable Insights. Subscribe now for unlimited access, or request a demo below.
Accordia Golf Trust (AGT SP) has not been a great success story since its IPO in August 2014. The stock went to market at a unit price of 0.97 SGD and was recently traded at 0.53 SGD. If we include the dividends received since the IPO (0.2387 SGD) the ‘real‘ adjusted price is still only 0.76 SGD.
In the past we have attended several management meetings and the 2017 company AGM but were disappointed on multiple occasions by management that either 1) did not care, 2) did not know how or 3) was held back by other corporate Japanese factors from creating shareholder value.
Over the last six months several new developments are potentially creating a cocktail that could finally create sustained value for AGT unitholders:
Appointment of new CFO who assures investors no repeat of “membership deposit debacle”
New five-year funding secured from two lenders
MBK Partners buys ORIX Golf Management
Value investor Hibiki Path Advisors buys 6.2% of the company
Clear focus on acquisitions and using its balance sheet strength
With its 2019 financial year ending in March, investors can be hopeful that its dividend in FY20 can grow to a minimum of 5 SGD cents suggesting a yield of 9.5%. If management injects assets a higher DPU is possible.
In November 2017, Toshiba Corp (6502 JP) bowed to the inevitable and issued shares in order to shore up shareholder equity ahead of the 31 March 2018 deadline where if the company had not announced a positive shareholder equity number, it would have been delisted according to the Enforcement Rules of the Tokyo Stock Exchange.
So it issued ¥600 billion of equity in an accelerated privately-negotiated placement to hedge funds. There was some jawboning later from domestic institutions who had not gotten the show on the deal, but they would do well to remember that when Toshiba was in dire straits earlier that year, and continued listing was not guaranteed because of accounting issues which were later overcome (before the equity issuance), it was the hedge funds who bought dozens of percent of the company – not domestic financial institutions. In any case, the equity was predictably needed, but as a way of making it clear that it would not be forever, the release accompanying the financing said the company would accelerate returns to shareholders once the sale of Toshiba Memory Corporation was complete.
That return of capital to shareholders was announced in June 2018 after the closing of the TMC transaction had been confirmed. Toshiba would buy back ¥700 billion of shares. At the time, that was up to 40% of shares outstanding, but the shares rose as the shares of companies with large buyback plans do, and it took until November to dot the “i”s and cross the “t”s on making sure that the cash in the bank account was deemed distributable capital surplus. On November 8th, a year after announcing the sale of equity, Toshiba announced the start of a Very Large Buyback. A few days later the company announced a large ToSTNeT-3 buyback, offering to buy back all ¥700 billion of shares the following morning at that day’s close. A week later the company had bought back ¥243 billion or more than 35% of the total buyback then announced further purchases would be made in the market.
That’s when the fun began.
For previous recent treatment on the Toshiba buyback, see the following:
ONWARD AND OUT – ZOZO (3092 JP), formerly Start Today, has been the sixth-most-traded large capitalisation stock over the last ten trading days after Benefit One (2412 JP), Rizap (2928 JP), Takeda Pharmaceutical (4502 JP), Hoshizaki (6465 JP), and Workman Co Ltd (7564 JP). According to Nikkei XTECH, on 25th December apparel maker Onward (8016 JP) suspended selling of its products on ZOZOTOWN and will leave the platform altogether. Although Onward products are estimated to account for less than 3% of total transactions on the site, there are concerns that other apparel makers will follow suit as a result of the emerging direct competition on the site from ZOZO’s private label. Since reaching our 4.0 ‘Overbought’ threshold on 9th July 2018, ZOZO shares have corrected by 57% – the worst performance of any large cap from that date – as concerns mounted over the private brand strategy and the behaviour of CEO Yusaku Maezawa. Since bottoming on 4th January, the shares have risen by 18% following positive comments from the CEO about sales over the New Year holiday period.
PRIVATE-LABEL STRETCH GOALS– The ‘teething problems’ of ZOZO entering the private-label apparel business have been well-documented by Michael Causton in a recent Insight on Smartkarma. Michael rightly questions the feasibility of the company scaling a ¥200b apparel business within the next three years while targeting an additional incremental ¥400b in e-commerce revenue, particularly as it has taken ZOZO twenty years to reach the first ¥100b in annual revenues. In the DETAIL section below, we shall examine ZOZO’s current and possible future financial condition as it strives to become one of the top-ten global fashion retailers.
‘ZOSO’ & THE STAIRWAY TO HEAVEN – In addition to some notable purchases of modern art at record-breaking prices, CEO Maezawa also last year booked himself on Space X’s first flight to the moon. With apologies, the lyrics of the peerless song from Led Zeppelin’s untitled fourth album – known by fans as ‘Zoso’ after the symbol designed by Jimmy Page for the inner sleeve – come to mind:-
There’s a lad(y) who’s sure All that glitters is gold And (s)he’s buying a stairway to heaven When(s)he gets there (s)he knows If the stores are all closed With a word (s)he can get what (s)he came for.
We have received requests to provide a calendar of upcoming catalysts for near-term M&A, stubs and erstwhile event-driven names. Below is a list of catalysts over the near-term for such names as below. If you are interested in importing this directly into Outlook or have any further requests, please let us know.
In the semiconductor industry, particularly in the DRAM sector, there has been significant consolidation leading some to hypothesize that there’s now an oligopoly that will cause prices to normalize and thus end the business’ notorious revenue cycles. Here we will take a critical look at this argument to explain its fallacy.
Get Straight to the Source on Smartkarma
Smartkarma supports the world’s leading investors with high-quality, timely, and actionable Insights. Subscribe now for unlimited access, or request a demo below.
While most news coverage is intensely focused on former Chairman Carlos Ghosn’s first public statements, defence strategy and Japan’s rather arcane justice system, we believe that news regarding the sudden “leave” of two Nissan executives is worth paying attention to as it may have ramifications for the fate of the alliance overall. We discuss the details below.
Primary/secondary Uranium supplies currently 112% of 2017 demand
Uranium supply deficits extremely unlikely before 2022
Global Uranium demand to fall 25-40% by 2050
Primary Uranium sector LT SELL
We have independently audited global nuclear construction statistics in order to determine future Uranium demand. Although near-term statistics match those in the public domain, long-term demand determined via construction pipeline illustrates substantial discrepancies. Compiling planned plant construction, operational extensions, nameplate upgrades, versus decommissioning announcements/events, and in many cases, public policy inertia; has led us to believe that despite historical primary supply shortages, global nuclear demand peaked in 2006.
Since plateauing and despite strong Chinese growth, nuclear power generation has fallen <2% over the past two decades, a decline that is predicted to accelerate as a number of developed and developing nations pursue other energy options.
The macro-trend not replacing existing nuclear infrastructure means (dependent on assumptions), according to our calculations, global uranium demand will decrease between 20 to 40% by 2050.
As opposed to signifying a fundamental change in underlying demand, we believe that recent Uranium price increases are the result of producers closing primary operations, and substituting production with purchases on the spot market to meet long-term contract obligations. In addition, hedge funds are buying physical uranium in order to realise profits on potential future commodity price increases. Critically, we determine that primary and secondary supplies are more than sufficient to meet forecast demand over the next four to five years; before taking into account substantial existing global uranium stocks, some of which are able to re-enter the spot market at short notice.
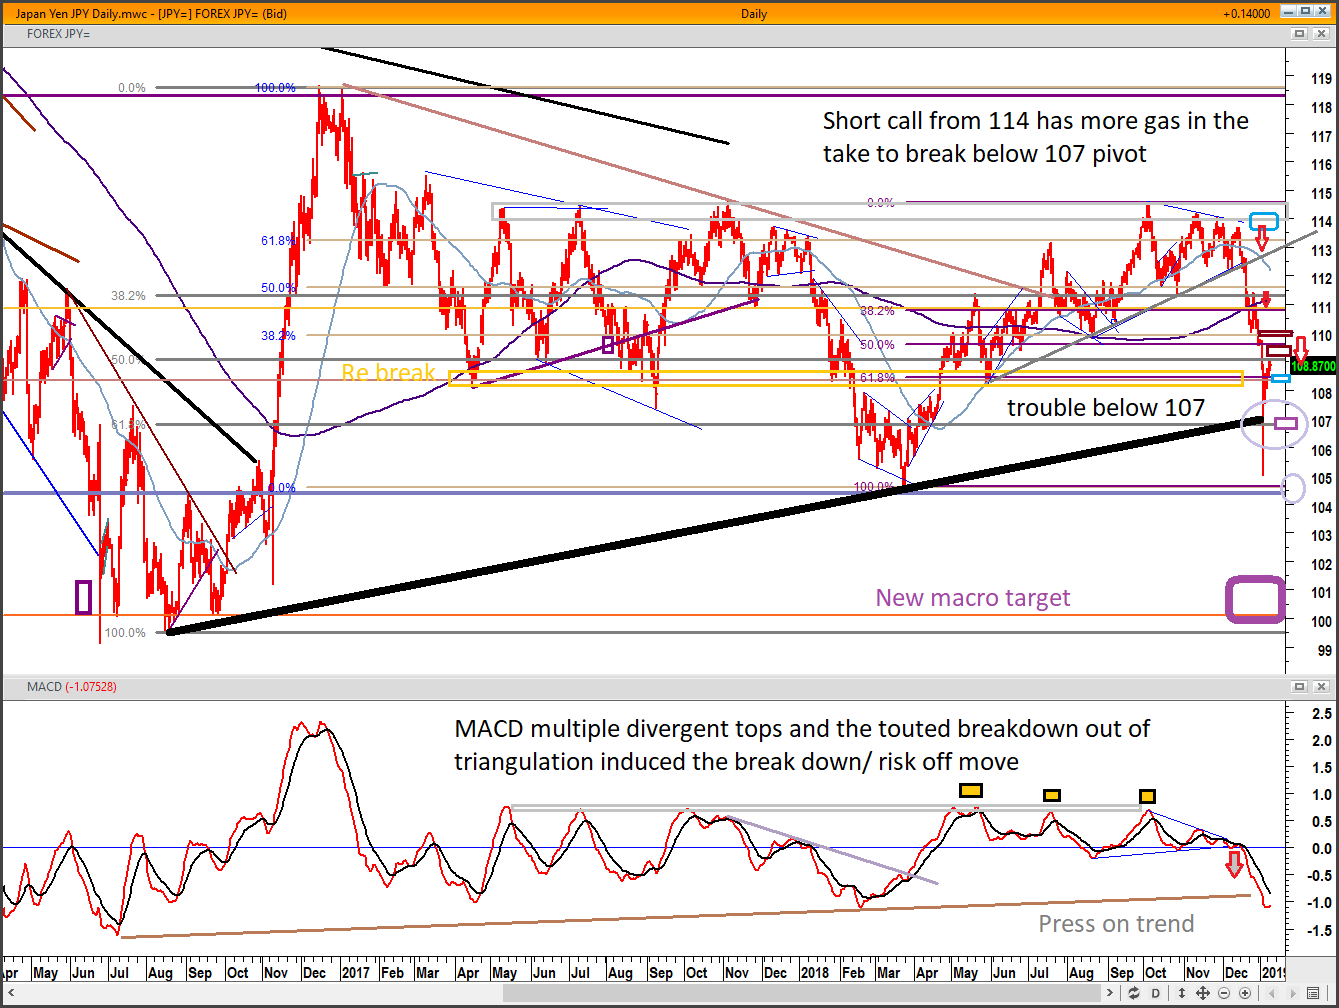
Major top and short call at USD/JPY 114 and flash decline did have a direct impact on a risk assets and the Nikkei in line with our S&P and Nikkei short calls. The second phase of USD/JPY weakness will usher in the next downturn in risk assets in late Q1 after some tactical posturing. We do view SPX 2,600 as a good level to re cycle shorts with some range work in store for February.
JPY crosses versus the AUD, GBP and Euro are currently nudging up against key resistance points that represent an interesting pivot point to stage a fresh decline (good risk aversion barometers).
We are seeing the knock on effect in Asian FX.
USD/JPY will surpass our original downside target of 108-109.
According to a local media outlet called Chosun Daily, it stated that one of the bankers in the deal (Deutsche Bank), already sent teaser letters of this deal to Tencent Holdings (700 HK) and KKR and in the teaser letter, it mentioned about potentially selling nearly 47% of Nexon Co Ltd (3659 JP) (Japan).
The question about whether or not Kim Jung-Joo decides to sell NXC Corp (Korea) or Nexon Co Ltd (3659 JP) (Japan) has important consequences not just for him and his family but also to the minority shareholders of Nexon Co Ltd (3659 JP). If Kim Jung-Joo decides to sell NXC Corp (Korea), there may not be much upside for the minority shareholders of Nexon Co Ltd (3659 JP) since current regulations do not require the buyers to pay potentially additional control premium to the minority shareholders as well.
However, if Kim Jung-Joo decides to sell Nexon Co Ltd (3659 JP) (Japan), there may be an opportunity for the minority shareholders to gain from an additional control premium. We think that this is one of the reasons why Nexon Co Ltd (3659 JP) shares are up 13% YTD as some of the investors may think that there could be a higher probability that Kim Jung-Joo ends up selling Nexon Co Ltd (3659 JP) (Japan), instead of NXC Corp (Korea).
The Japanese telecom market was more volatile in 2018 than anticipated. However, Chris Hoare remains broadly positive on the sector for 2019. While pressure on the revenue line is intensifying, we do do not expect a price war to break out. In fact, we look for volatility to ease as the year progresses. Operators point to opex reductions and handset subsidy reductions to offset revenue weakness. We think that earnings are likely to surprise on to the upside. Over time we also look for dividend payout ratios to gradually rise, with the Softbank Corp (9434 JP) (KK) listing the long term catalyst. For Softbank Group (9984 JP) (SB) we look for market confidence to improve on the Vision Fund strategy, as profitable exits/up-valuations of assets such as Uber are announced.
The sector is recovering from NTT Docomo’s (9437 JP) price cut announcements but we don’t think they will slash prices (cuts will be selective). Our top pick is now KDDI (9433 JP) which could actually benefit from Rakuten’s (4755 JP) entry (as the roaming partner). DoCoMo is most affected but there are plenty of cost cutting opportunities. NTT (Nippon Telegraph & Telephone) (9432 JP) has optimistic guidance with substantial opex and capex cost cuts planned. Our order of preference for the stocks is now: KDDI (Buy), followed in order by NTT (Buy), SB Group (Buy), DoCoMo (Buy) and SB Corp (Neutral). We do not currently cover Rakuten.
Get Straight to the Source on Smartkarma
Smartkarma supports the world’s leading investors with high-quality, timely, and actionable Insights. Subscribe now for unlimited access, or request a demo below.
After dropping 60% from a high of ¥4,830 last February 27 to a 52-week low of ¥1,945 on December 26, THK closed at ¥2,062 on December 28, the last trading day of 2018.
New orders peaked in the three months to Dec-17. The order backlog peaked in the three months to Mar-18, and so did the share price. Sales and operating profit peaked in the three months to Jun-18. Demand from the company’s top three user categories – electronics (semiconductor production equpment in particular), machine tools, and general industry – has been moving in parallel. By region, new orders from China have dropped most rapidly, followed by orders from Taiwan and Japan.
After double-digit positive comparisons in the nine months to Sep-18, management is guiding for a 30% year-on-year decline in operating profit in 4Q of FY Dec-18. Judging from the orders trend and economic situation, substantial declines in sales and profits are likely in FY Dec-19. If demand from China picks up following a trade agreement with the U.S. sometime next year, there should be a moderate recovery going into FY Dec-20.
The shares are now selling at 7.7x management’s EPS guidance for FY Dec-18 and 0.9x book value at the end of Sep-18. Our forecast puts the shares on 11.9x earnings for FY Dec-19 and 10.4x earnings for FY Dec-20E. Valuations are at the bottom of their recent historical ranges. When orders recover, the stock price should, too.
THK is the world’s top producer of linear motion guides, which enable high-speed, high-precision operation of machine tools, semiconductor production equipment and other machinery. Management estimates the company’s global market share at about 50%. Competitors include Nippon Thompson (6480 JP) and NSK (6471 JP) in Japan and several companies headquartered in Europe, the U.S. and China. THK sells worldwide and has production facilities in Japan, Europe, the Americas, China, Taiwan, Southeast Asia and India. The company is financially sound, with a current ratio of 2.9x and net cash equal to 14% of equity at the end of Sep-18.
Get Straight to the Source on Smartkarma
Smartkarma supports the world’s leading investors with high-quality, timely, and actionable Insights. Subscribe now for unlimited access, or request a demo below.